Monitoring project stats: summary, dashboard, and reports
Traqq provides several ways to analyze project-related data across your workspace: the Summary tab in the project profile, the Dashboard section, and the Reports section.
Summary
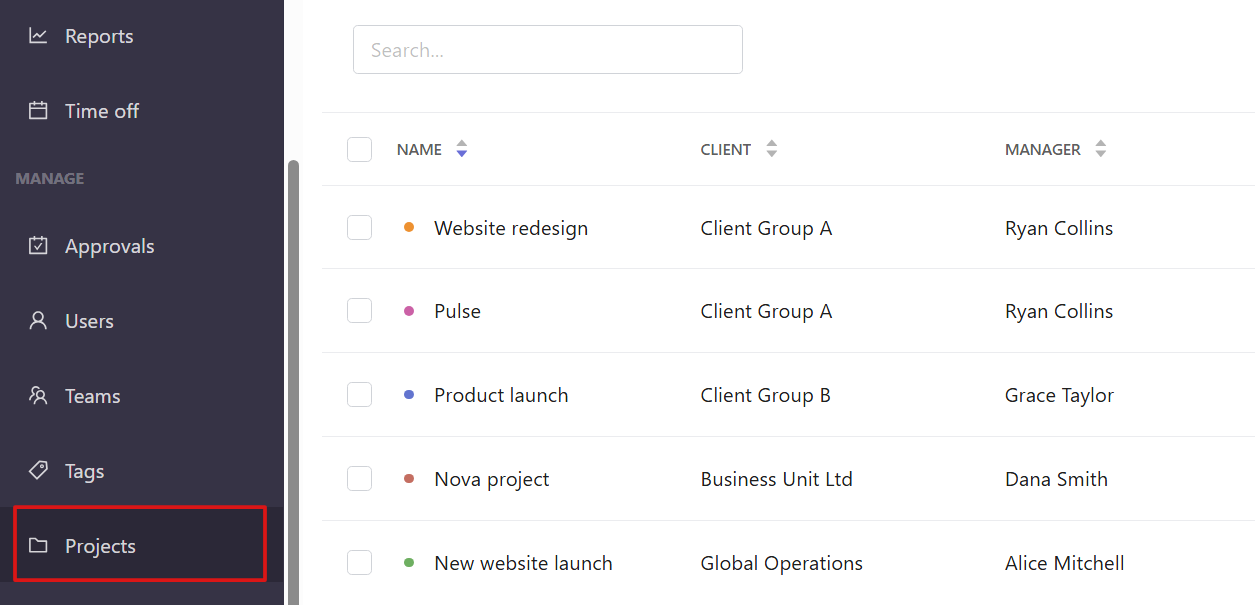
Open the Projects section from the left sidebar.
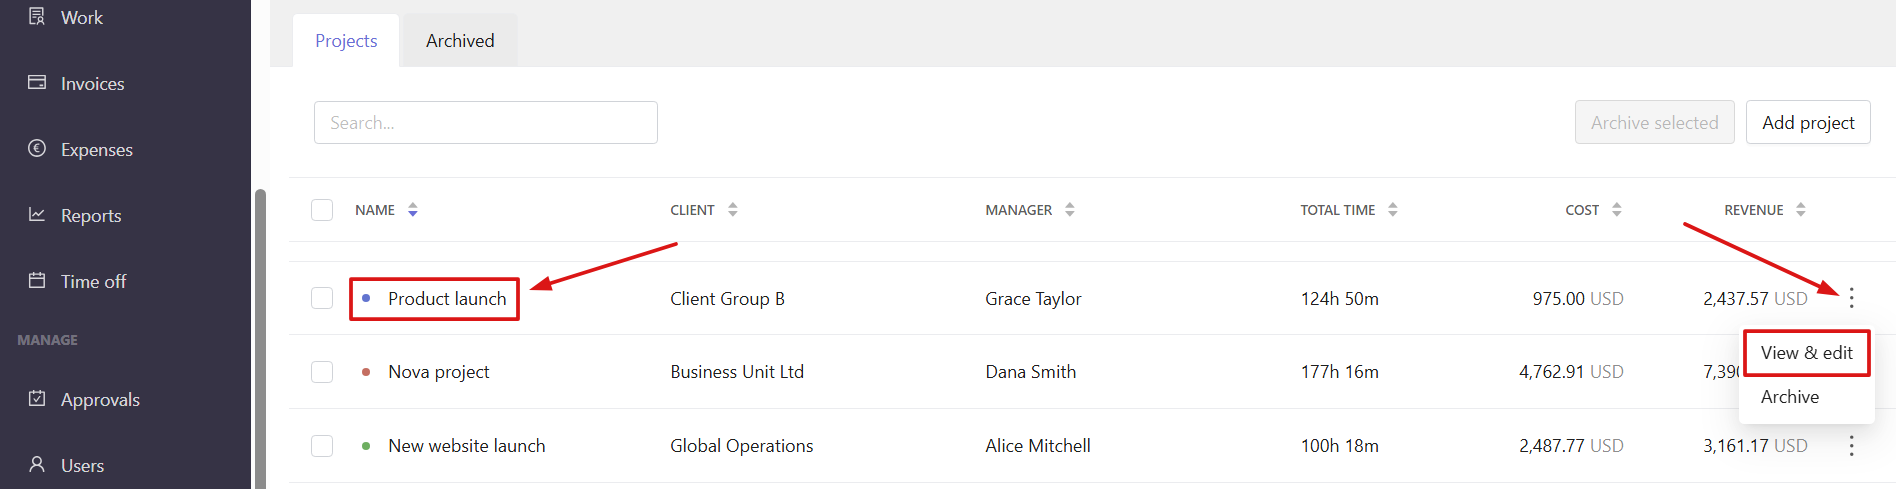
Click the project name in the list or select View & edit from the three-dot menu to access the project profile.
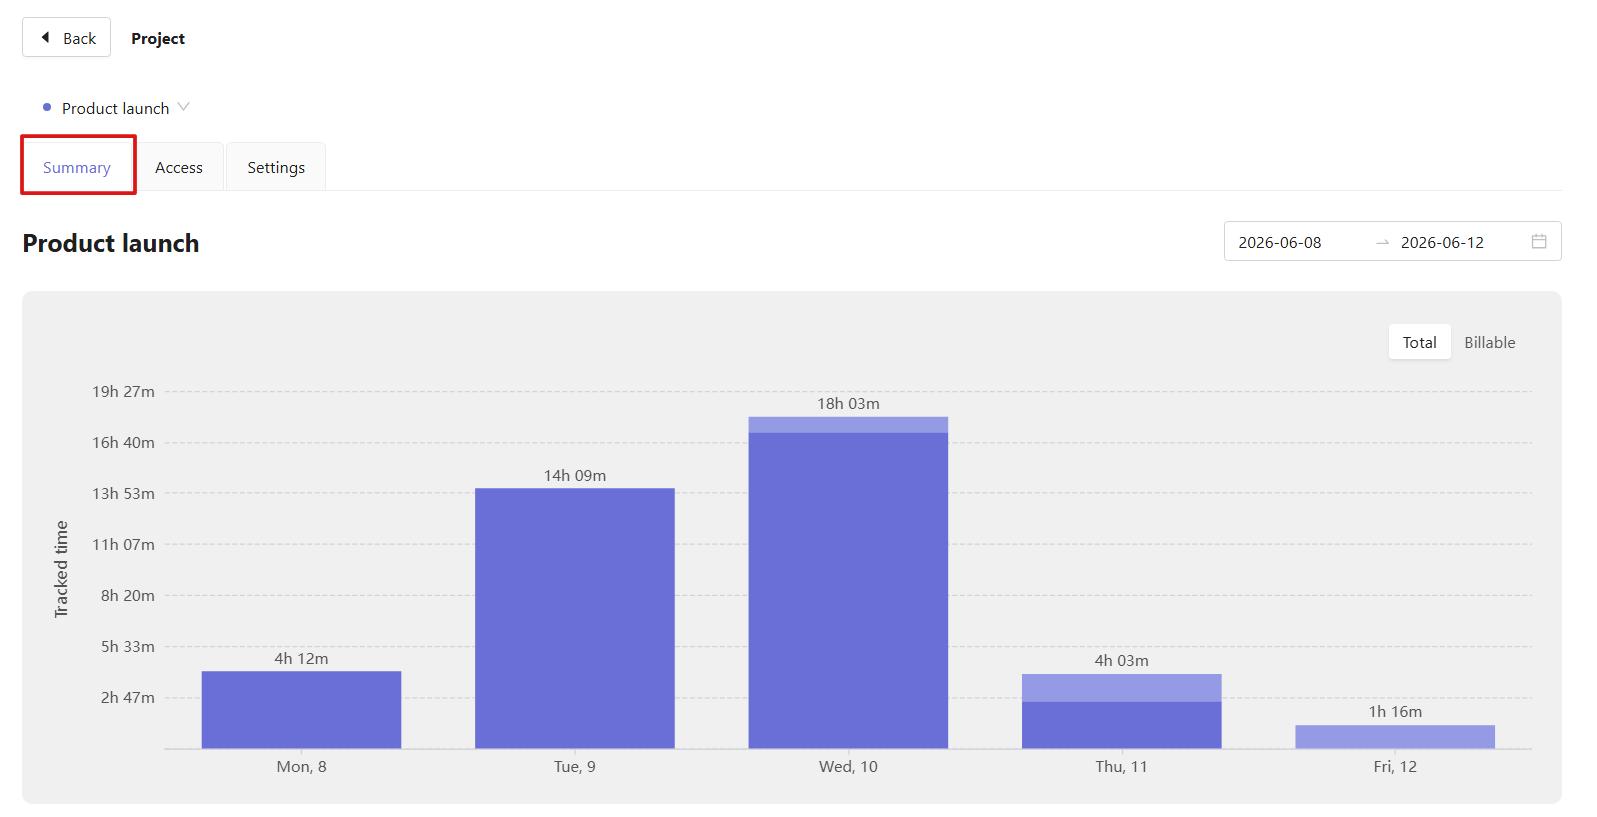
The Summary tab gives you an overview of project performance.
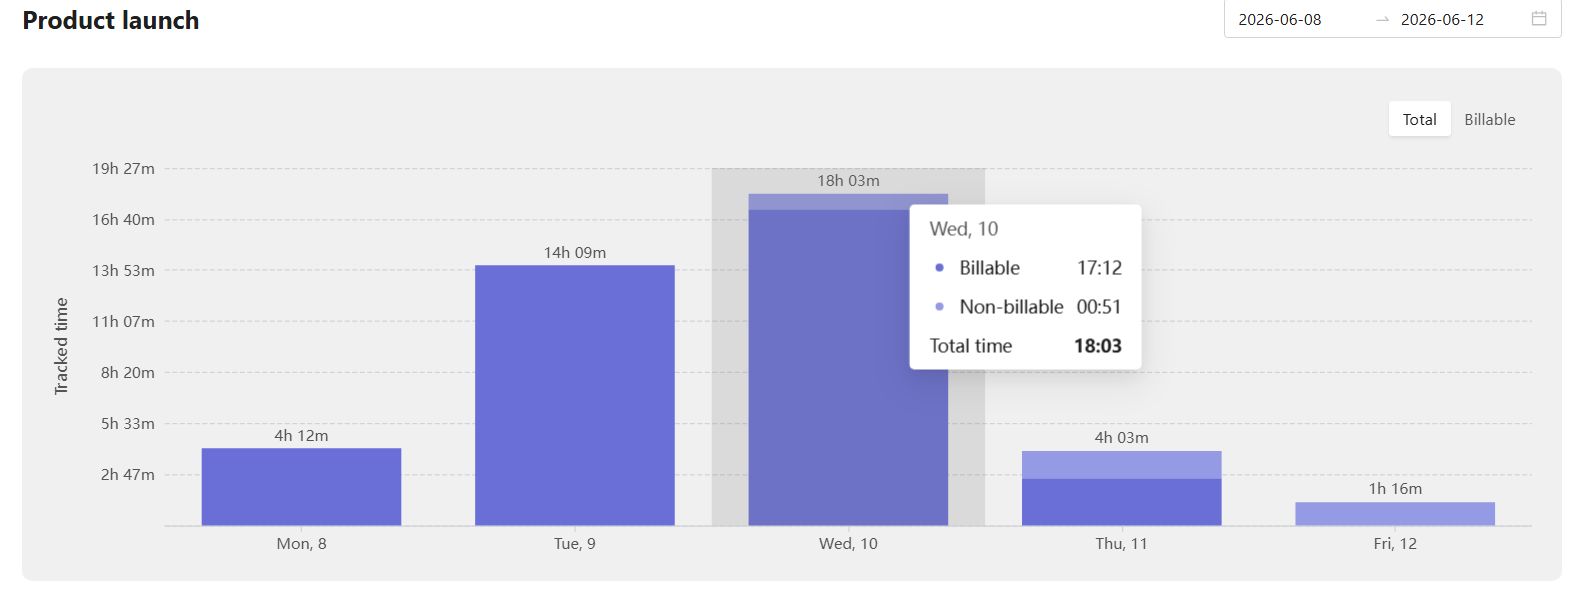
At the top, you can see a visual breakdown of tracked time for the selected period, including how work is distributed across days.
Hover over the chart to see the billable and non-billable time breakdown for a specific date.
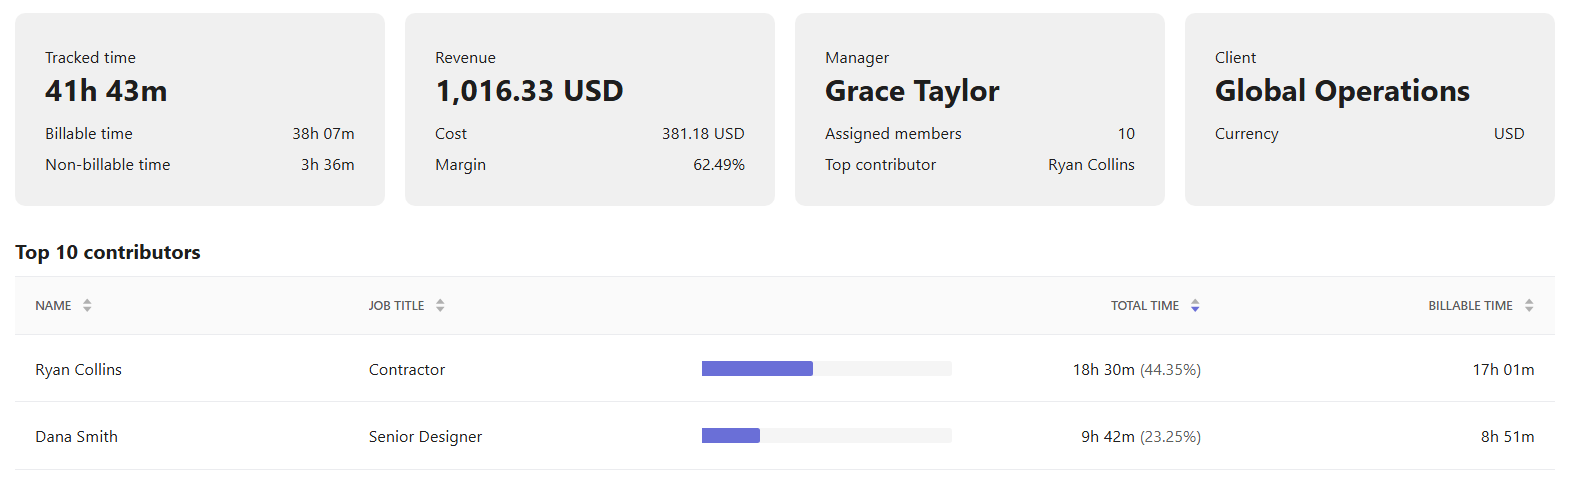
Below the chart, you can check key project metrics:
- Total tracked time
- Billable and non-billable time
- Revenue
- Cost
- Margin
You can also see project manager, connected client, number of assigned members, and top contributors.
The contributor section shows how work is spread across the team, including total and billable time per user.
Dashboard
You can also look at project data from the Dashboard section in the left sidebar.
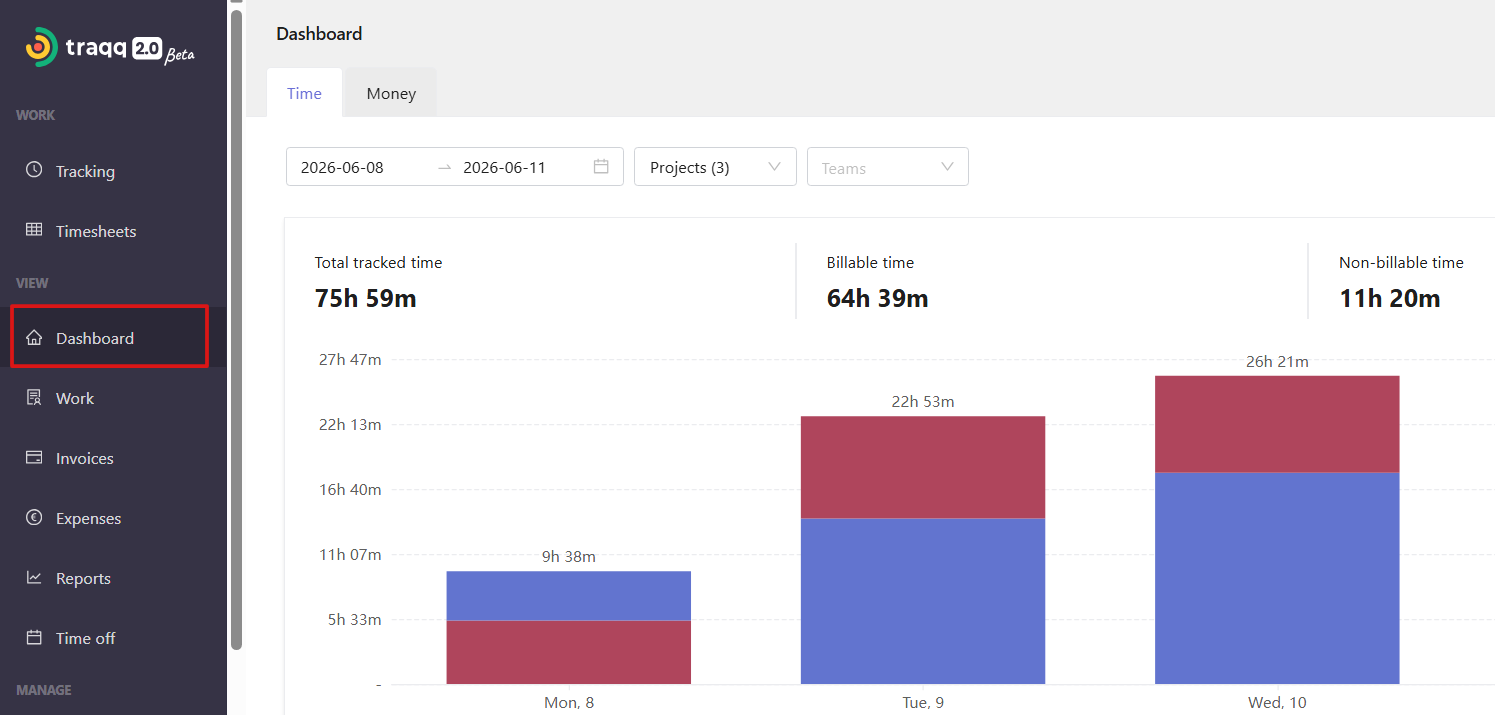
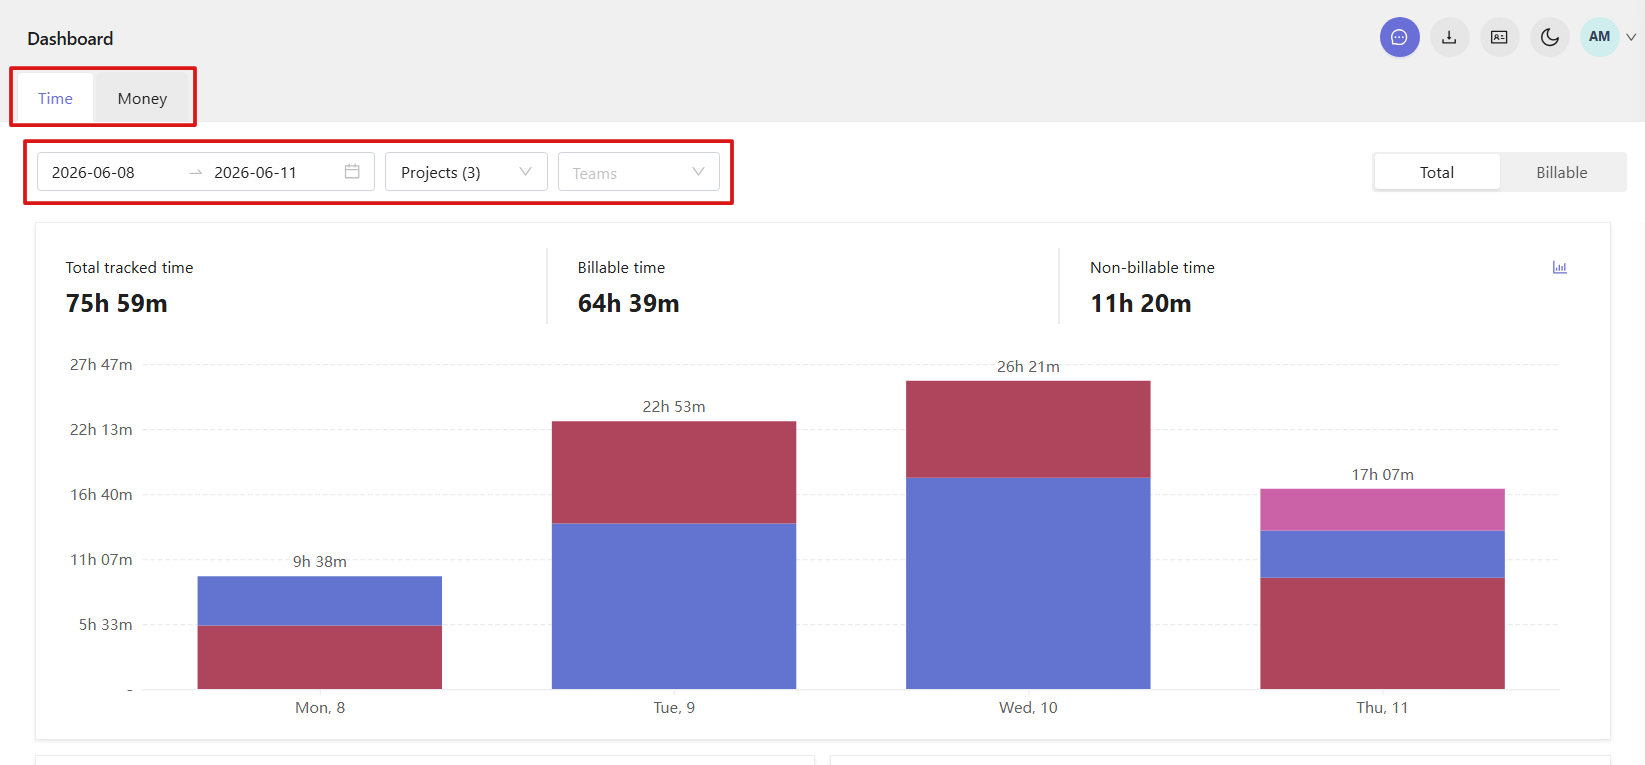
The Dashboard shows tracked time, workload distribution, and financial data.
You can switch between Time and Money tabs and use filters to select a reporting period and projects and narrow data by teams.
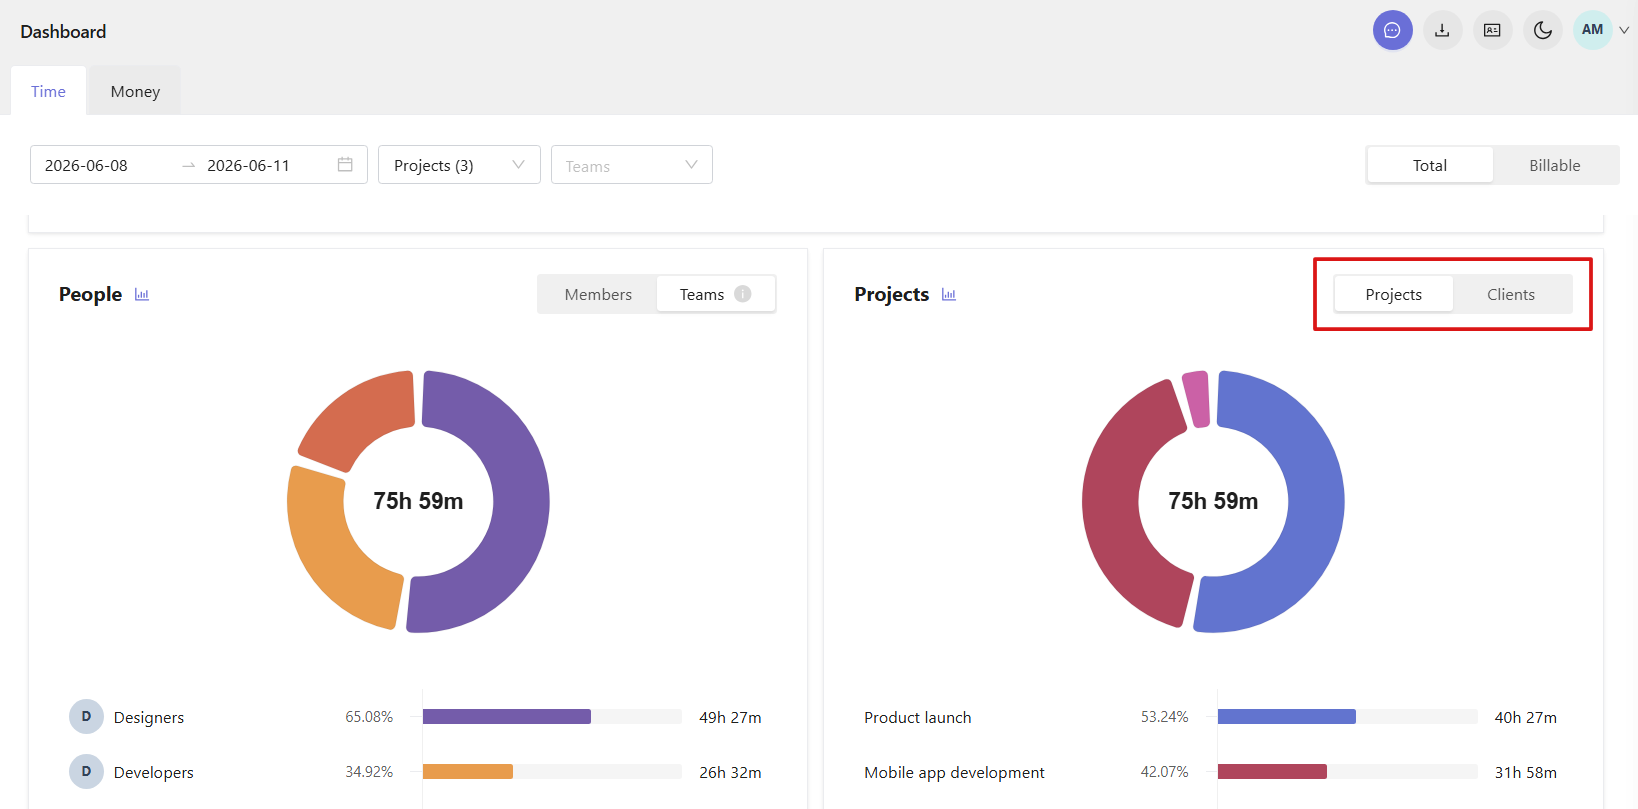
In the Time tab, the pie chart below the bar chart shows how time is distributed across projects. You can switch between Projects and Clients using the controls above the chart.
To learn more about Dashboard, see this article.
Reports
Reports allow you to analyze tracked time, billable hours, revenue, and cost across one or more projects.
Open the Reports section from the left sidebar and choose the Time tab.
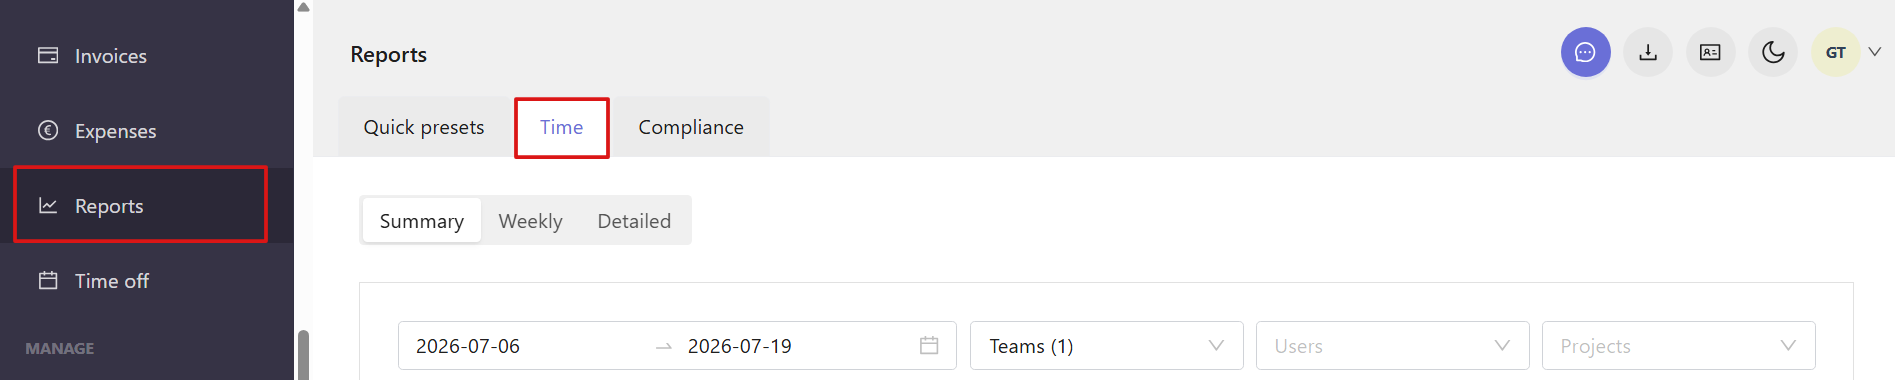
The Time tab includes three views: Summary, Weekly, and Detailed.
Summary view
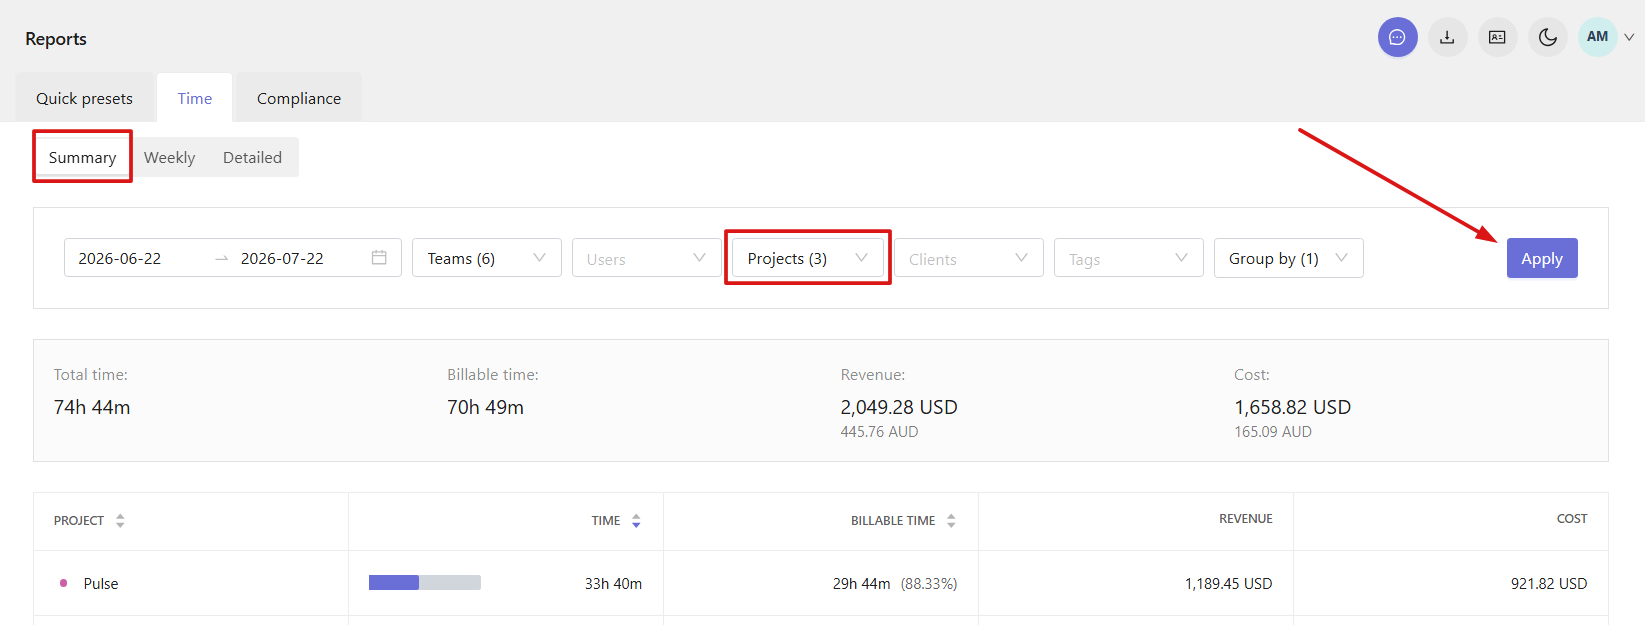
The Summary tab shows overall project statistics for the selected period. To view data for specific projects, choose one or more projects using filters and click Apply.
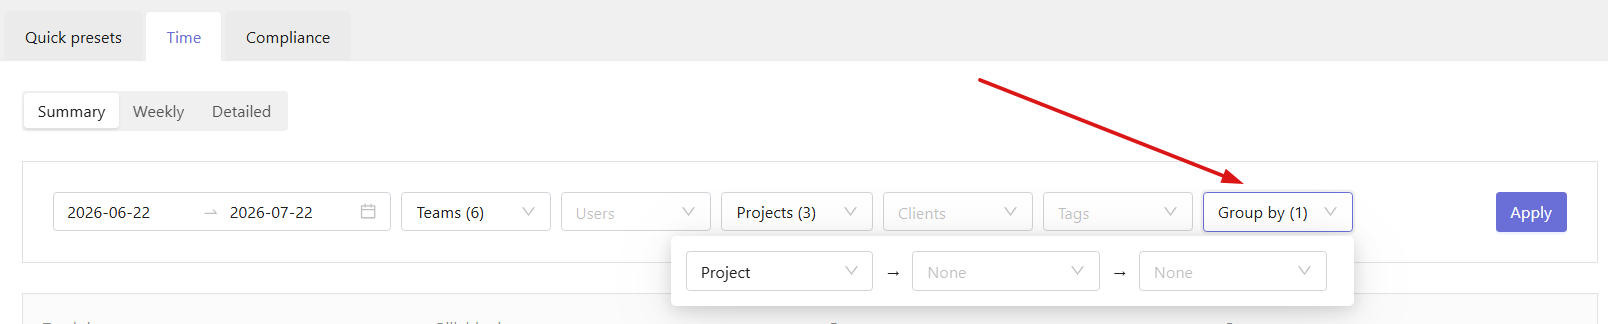
You can also group data by day, week, month, user, team, project, client, or tag.
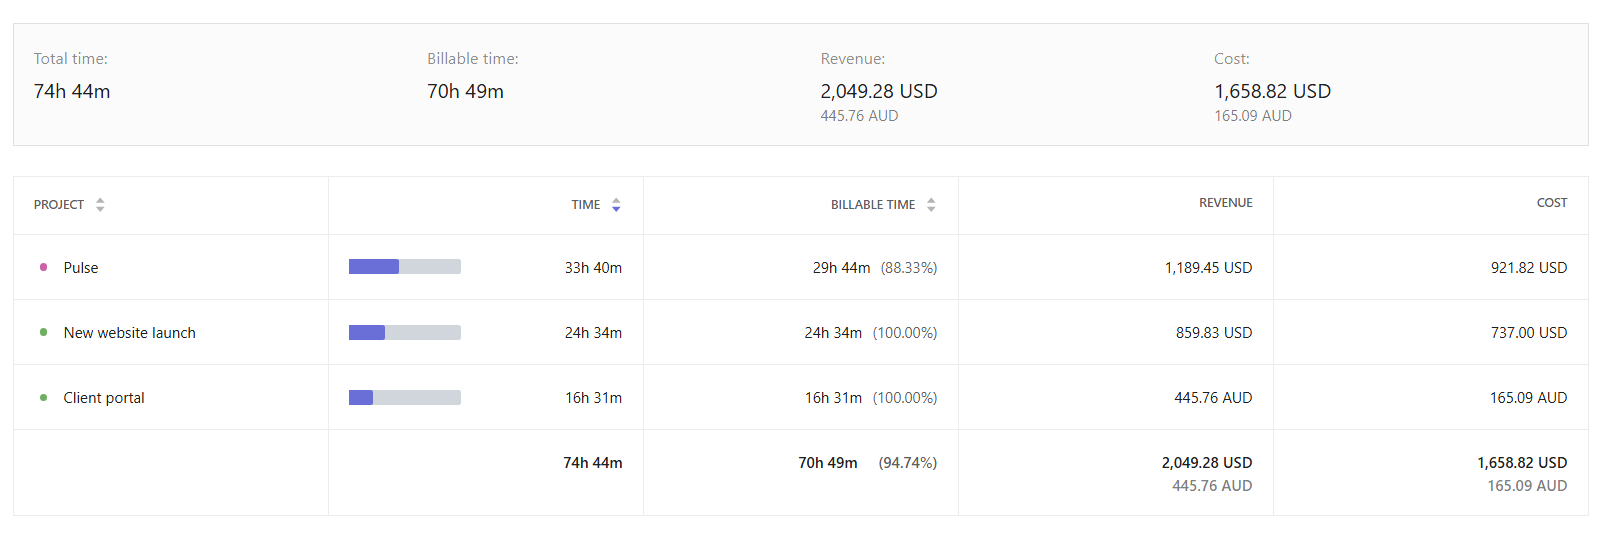
At the top of the results, you see total tracked time, billable time, revenue, and cost.
Below that, data is grouped based on the selected option in the Group by filter. The table shows tracked time, billable time, revenue, and cost for each group.
Weekly view
The Weekly tab shows total tracked time, billable time, revenue, and cost for the selected week. To view data for specific projects, choose one or more projects using filters and click Apply.
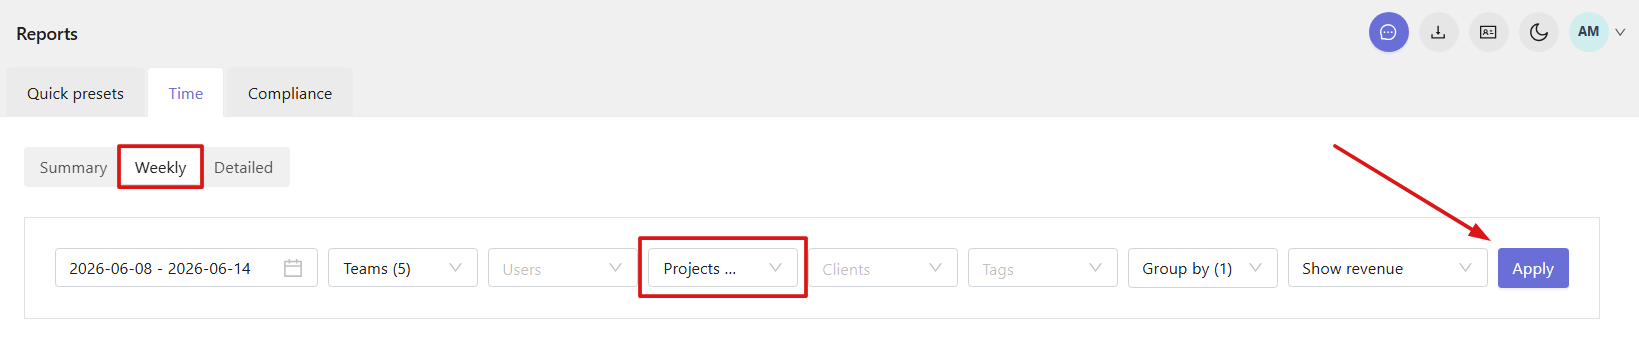
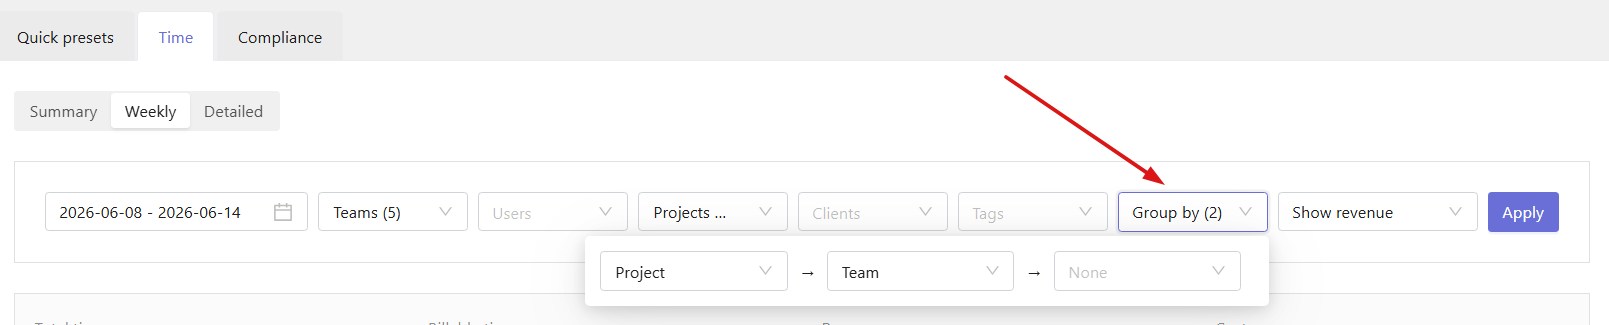
You can group data by user, team, project, or client.
You can also filter data by total tracked time, billable time, revenue, cost, or profit.
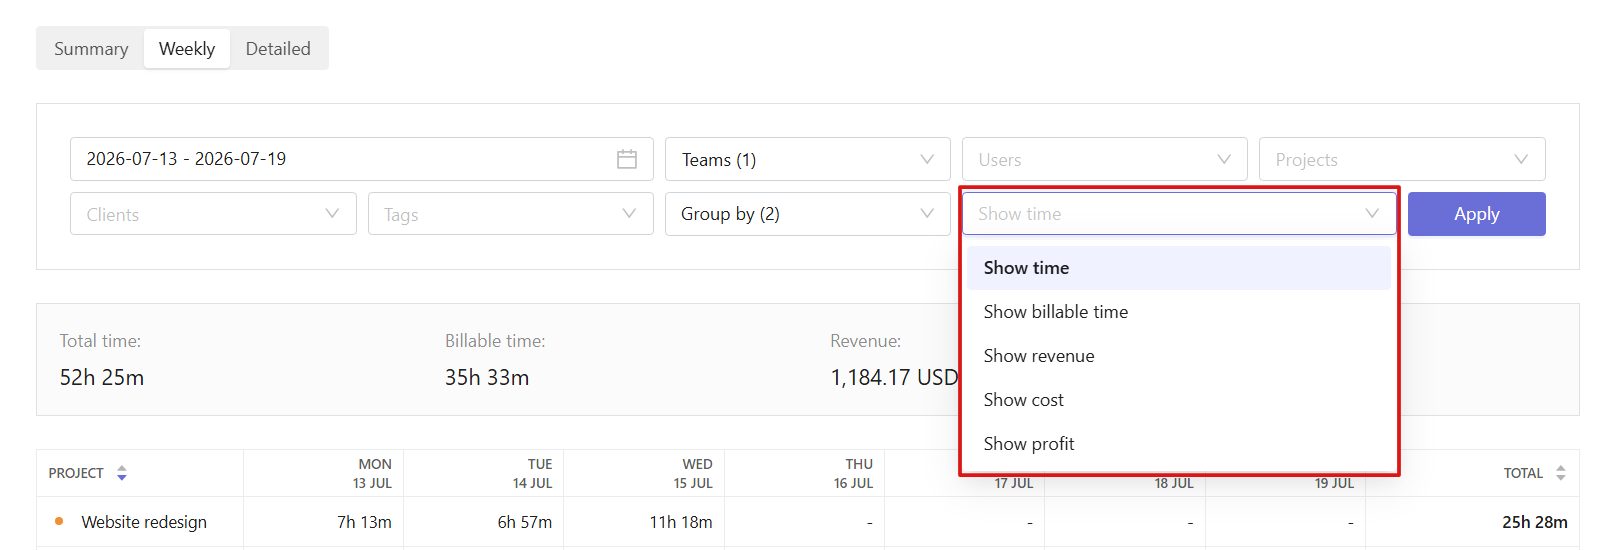
In the table, you can see a weekly breakdown of time, revenue, cost, or profit depending on the chosen filter.

Detailed view
The Detailed tab shows individual time entries for the selected period. To view data for specific projects, choose one or more projects using filters and click Apply.
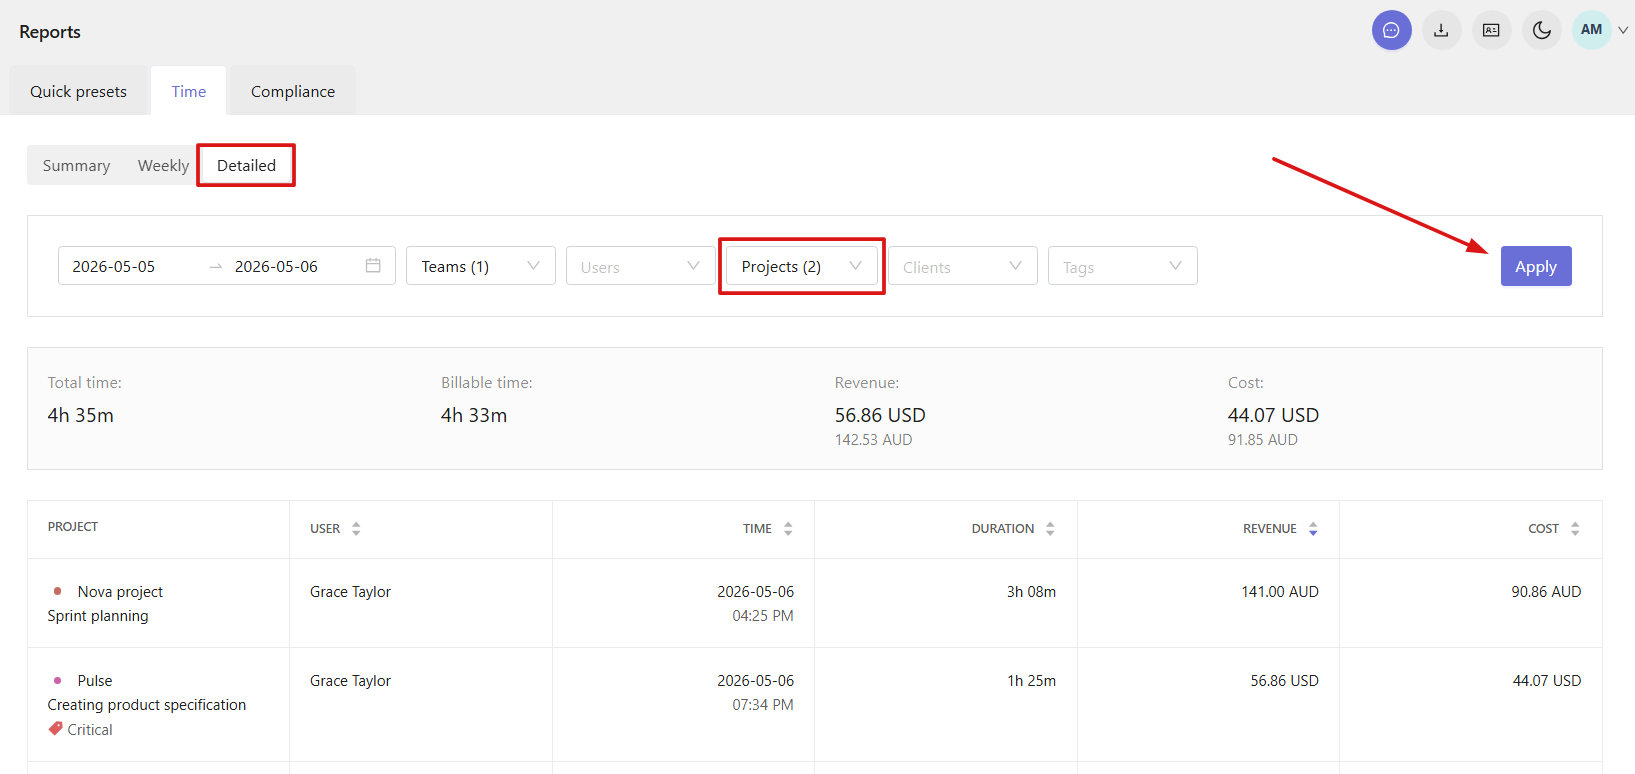
Each entry includes project name, task description and tags, user, date and time, task duration, revenue, and cost.