Activity report
The Activity report helps you understand how tracked time and work activity are distributed across users, teams, and time periods.
You can:
- - Analyze workload distribution across teams and users
- Review tracked time and idle time patterns
- Understand activity levels during tracked work sessions
- Compare activity data across different dates and teams - Important note: this report reflects only data tracked using the desktop app. Also, idle time and input activity data are available only when the Input activity & idle time feature is enabled. Learn more in this article.
- To access the data, open the Reports section from the left sidebar and select the Activity tab.
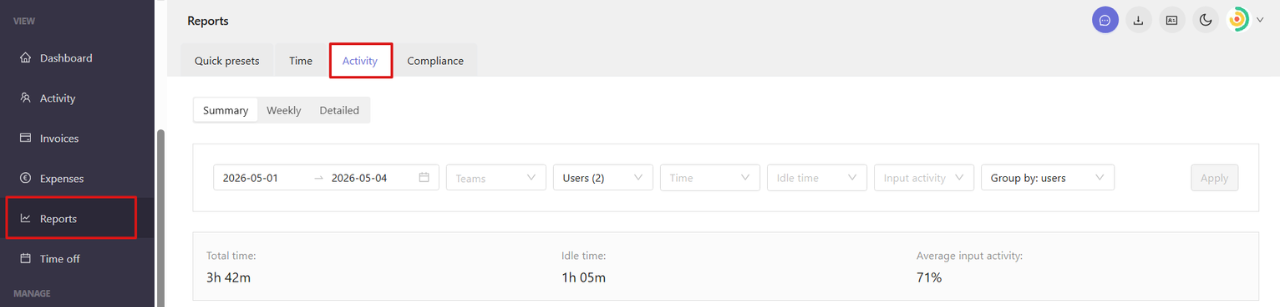
- At the top of the page, you can switch between the available views:
- - Summary
- Weekly
- Detailed 
- Each view provides a different level of detail, from aggregated activity metrics to day-by-day breakdowns.
Summary view
The Summary tab provides an overview of activity data for the selected period. This view helps you quickly understand overall tracked time, idle time, and activity levels across the workspace.
You can filter the report by date range, teams, users, work time ranges, idle time, and input activity percentage. After setting filters, click Apply to update the report.

You can also organize the report using the Group by option and switch between users and teams.
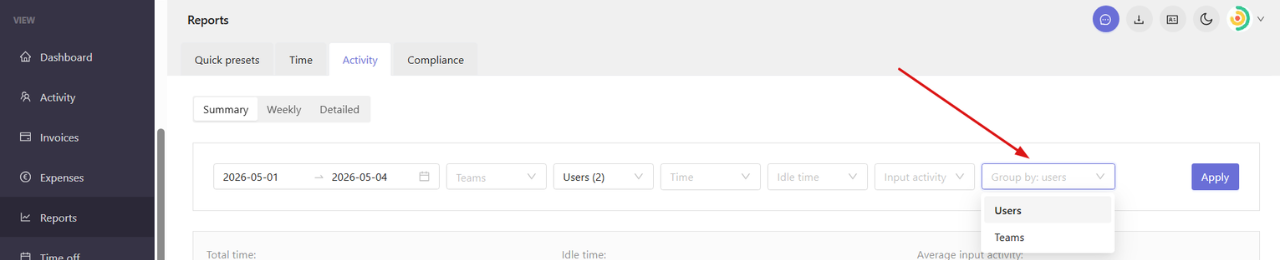
At the top of the report, you can see workspace totals for the selected period:
- - Total tracked time
- Idle time
- Average input activity - Below the totals, the table displays a breakdown for each user or team, depending on the selected grouping.
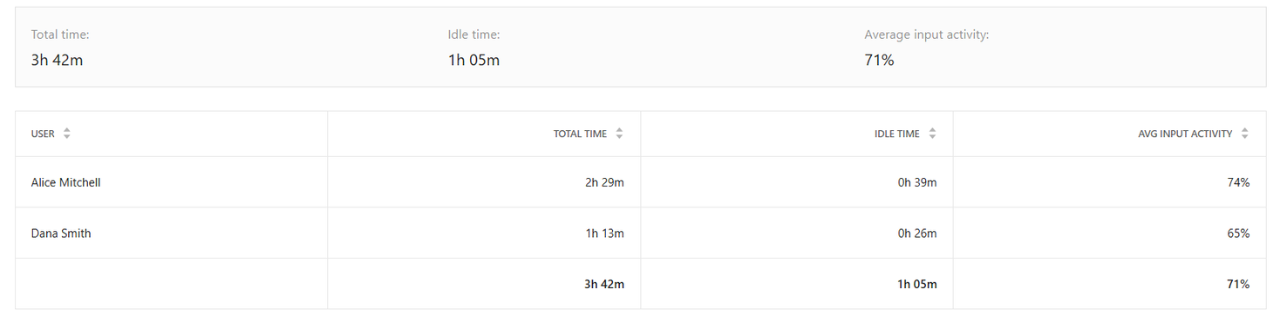
-
Weekly view
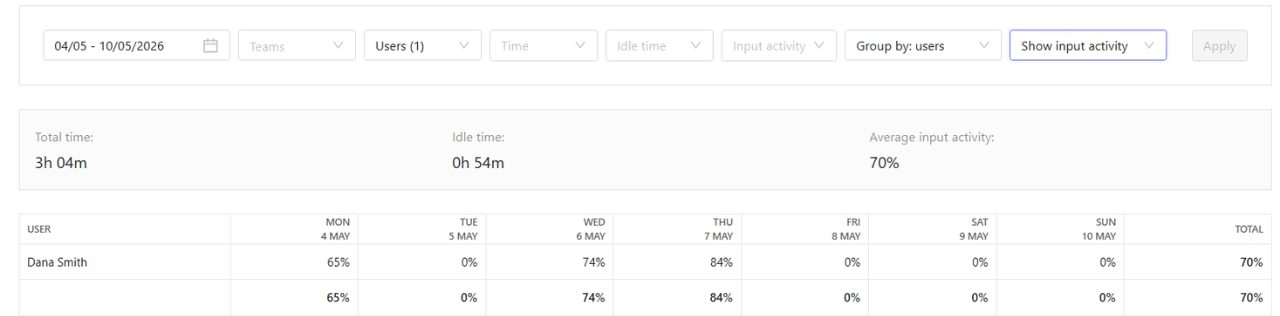
- The Weekly tab shows activity data distributed across days within the selected period. This helps you analyze how work activity changes throughout the week.
- You can filter the report by week, teams, users, work time ranges, idle time, and input activity percentage. You can also switch grouping between users and teams.

- In this view, you can choose which metrics to display in the table, including:
- - Total time
- Idle time
- Input activity 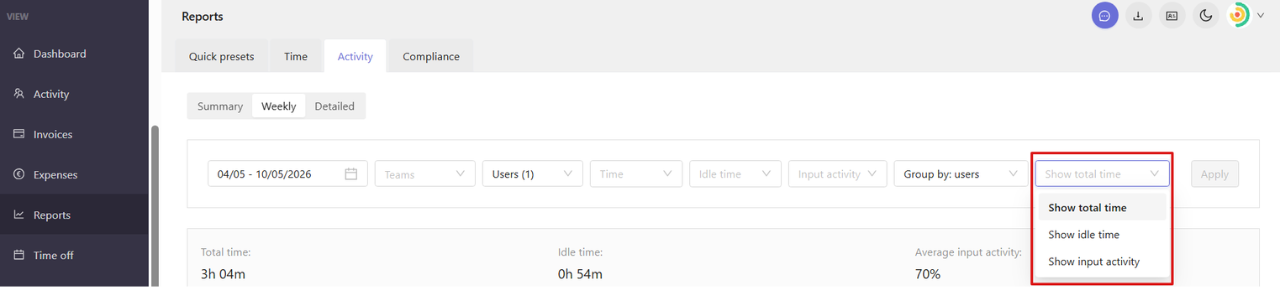
- These options help you focus on specific activity patterns across the selected week.
- The table shows daily values for each user or team, making it easier to compare activity between different days.
-
Detailed view
- The Detailed tab provides a granular breakdown of activity data.
- You can filter the report by date range, teams, users, work time ranges, idle time, and input activity percentage.

- Here you can see:
- - User
- Date
- Total time
- Idle time
- Average input activity 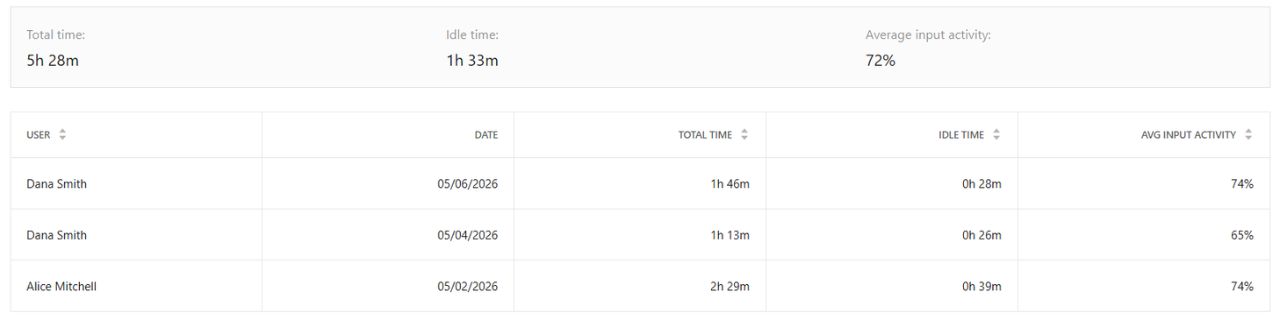
- Each row represents a specific date for a user or team, making it easier to review activity data in detail.