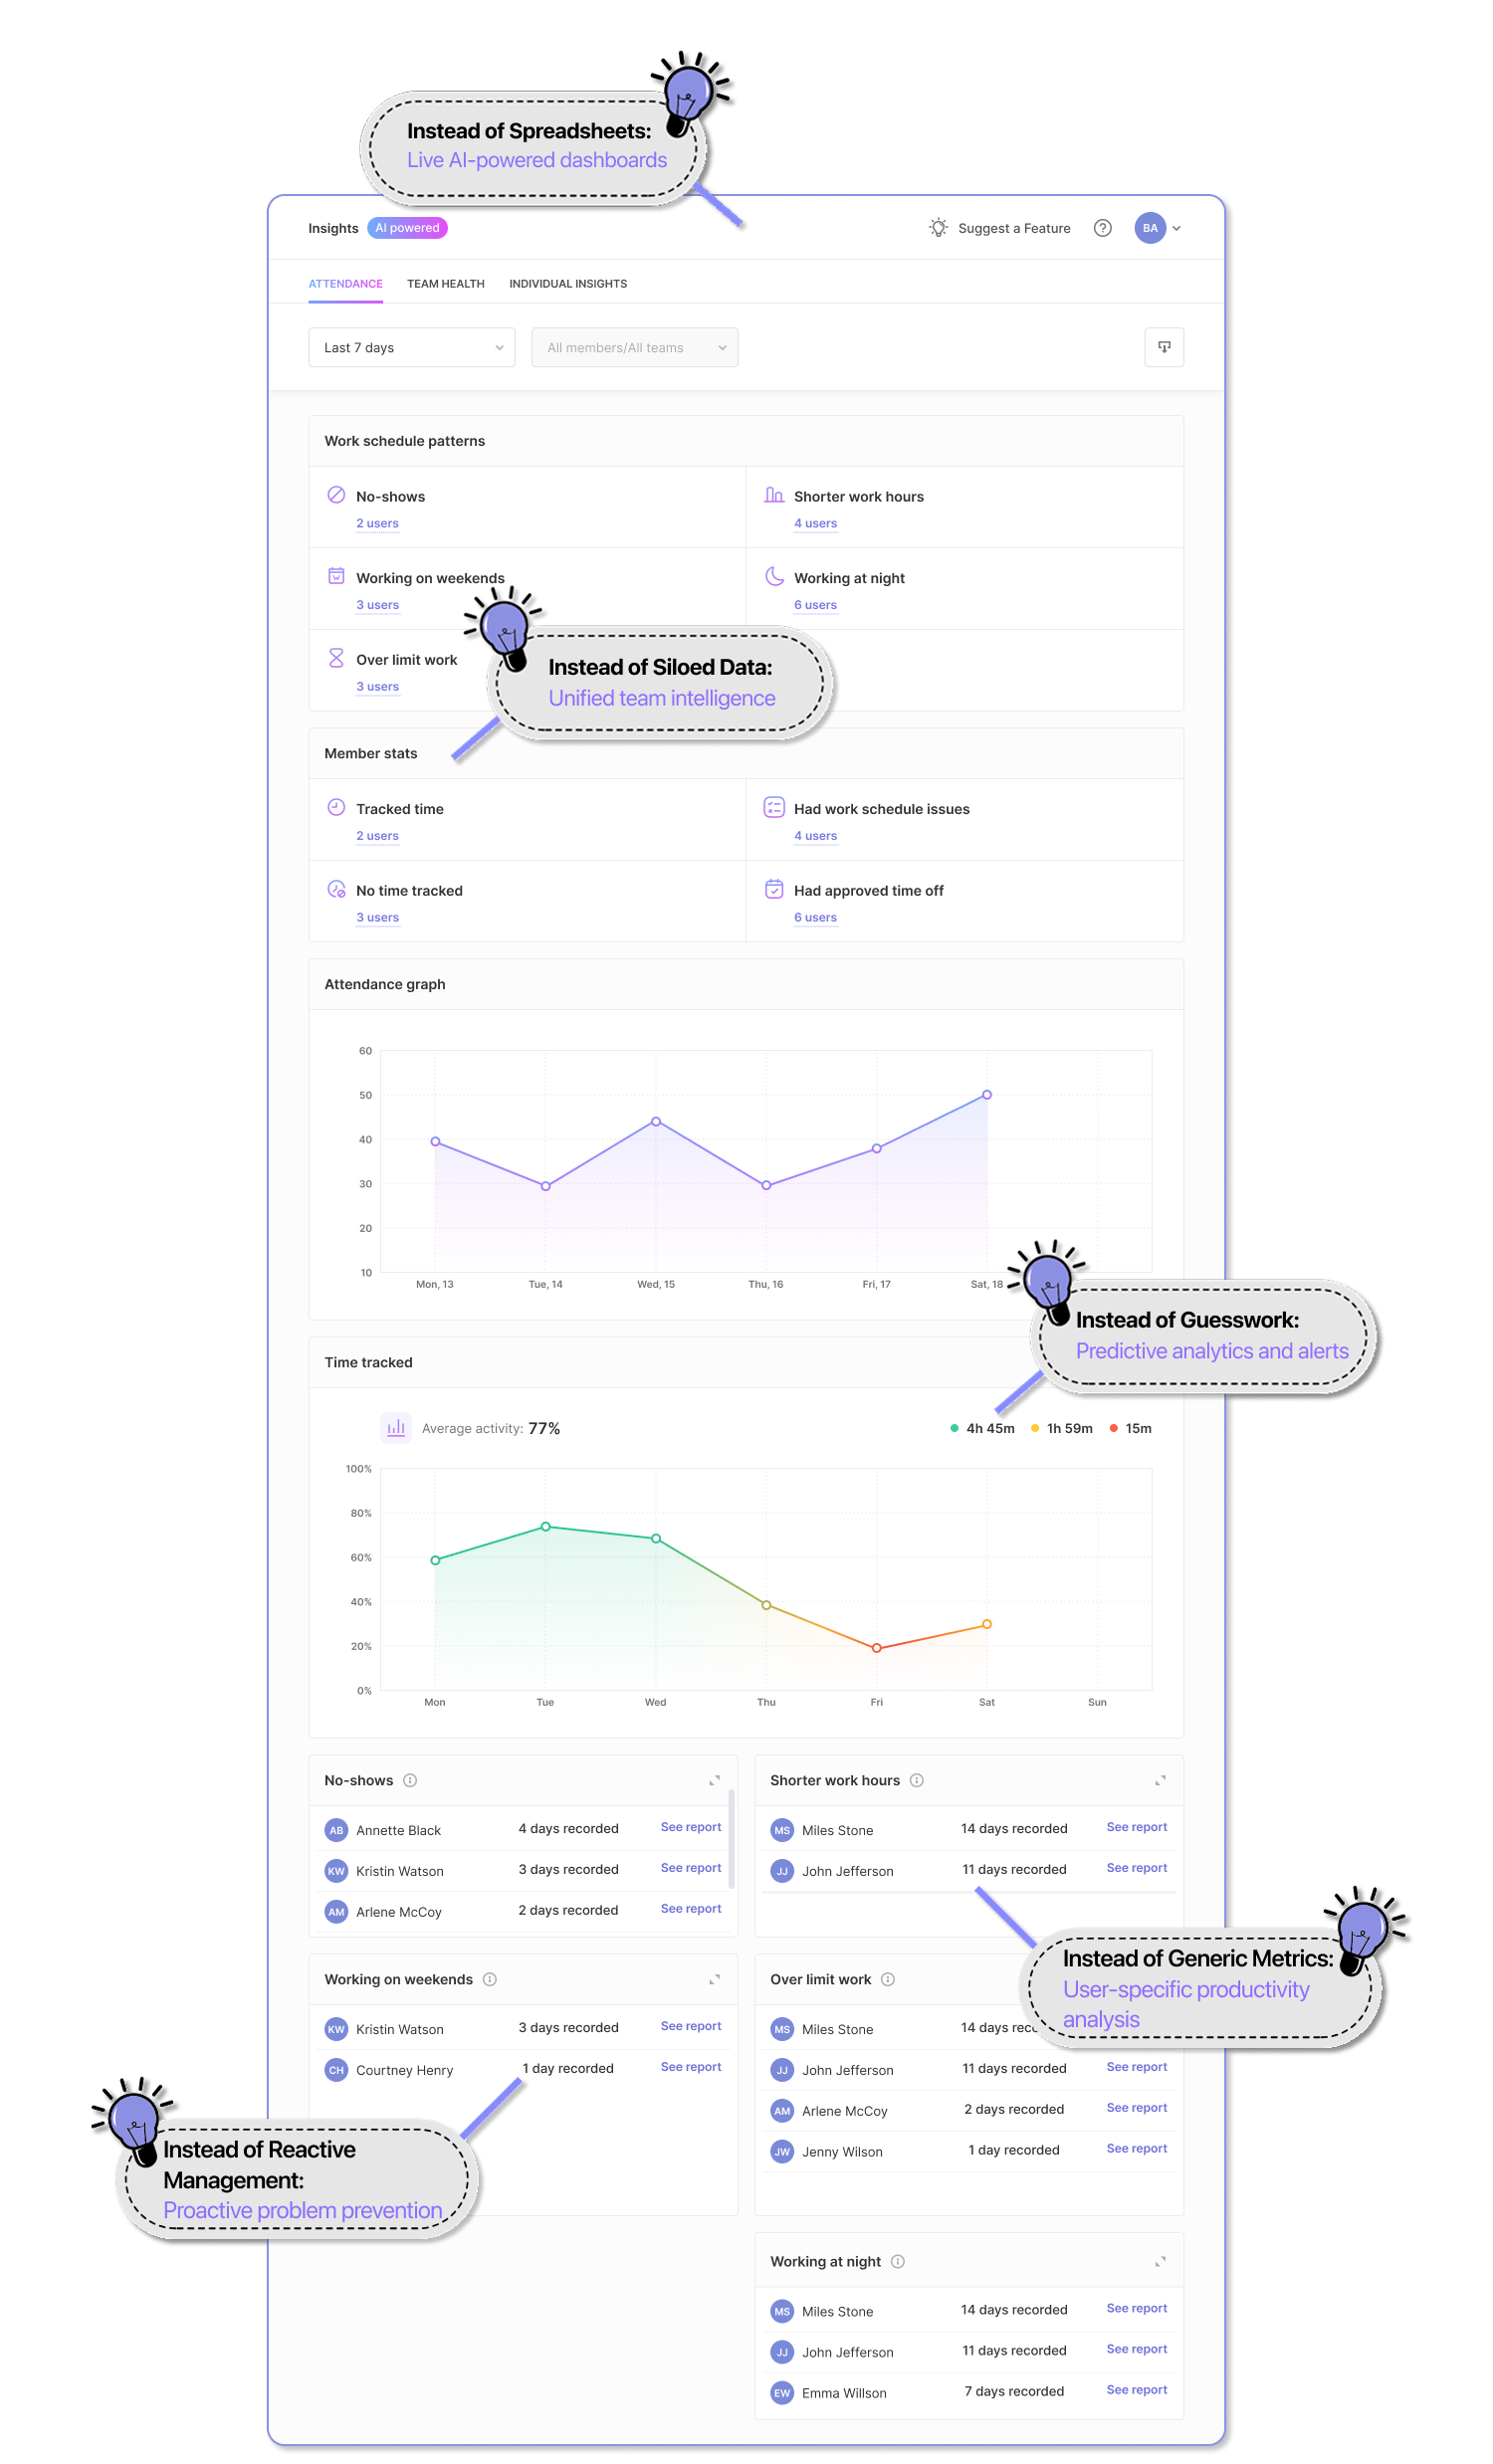
AI-powered analytics to transform your workflows
See exactly what’s happening across your teams at any moment with Traqq’s AI-powered dynamic dashboards.
Your team’s performance, decoded by AI
Still relying on gut feelings about team productivity? Wondering why some projects soar while others stall? Can’t figure out if your team is headed for burnout or boredom? Traditional metrics show hours logged but miss the story behind team dynamics.
Join thousands of leaders making data-driven decisions with AI analytics.
Traqq’s AI-powered analytics reveal what’s really happening across your organization. Monitor team health with predictive burnout detection. Optimize workload distribution before projects derail. Discover productivity patterns that drive results. See comprehensive insights across three intelligence categories. All through sophisticated AI analysis – no invasive monitoring, just actionable intelligence that helps you lead better.
Intelligence across every dimension
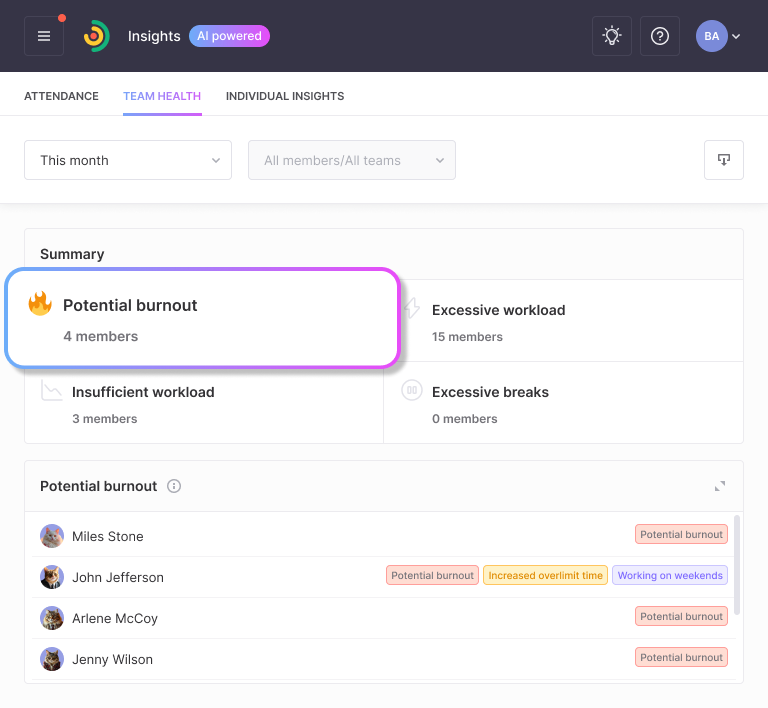
Team Health Analytics
AI monitors burnout indicators, workload balance, and engagement patterns. See who needs support before performance drops.
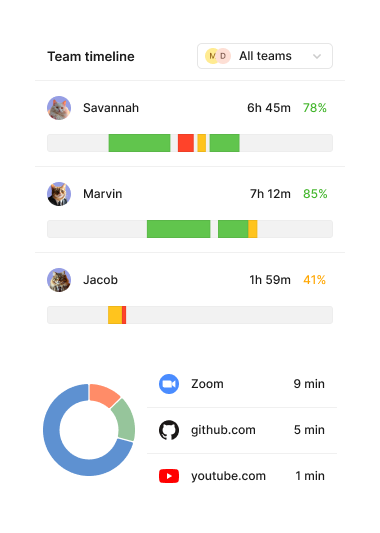
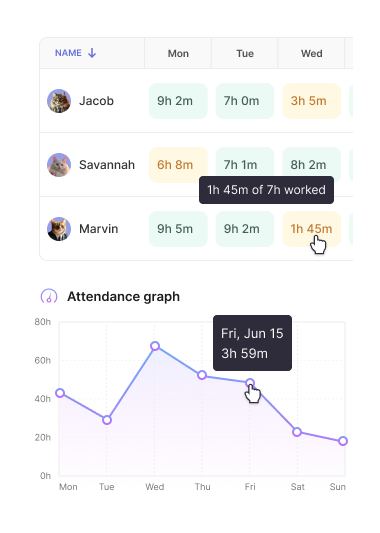
Individual Insights
Track productive time, peak performance windows and activity patterns. Optimize schedules for maximum output.
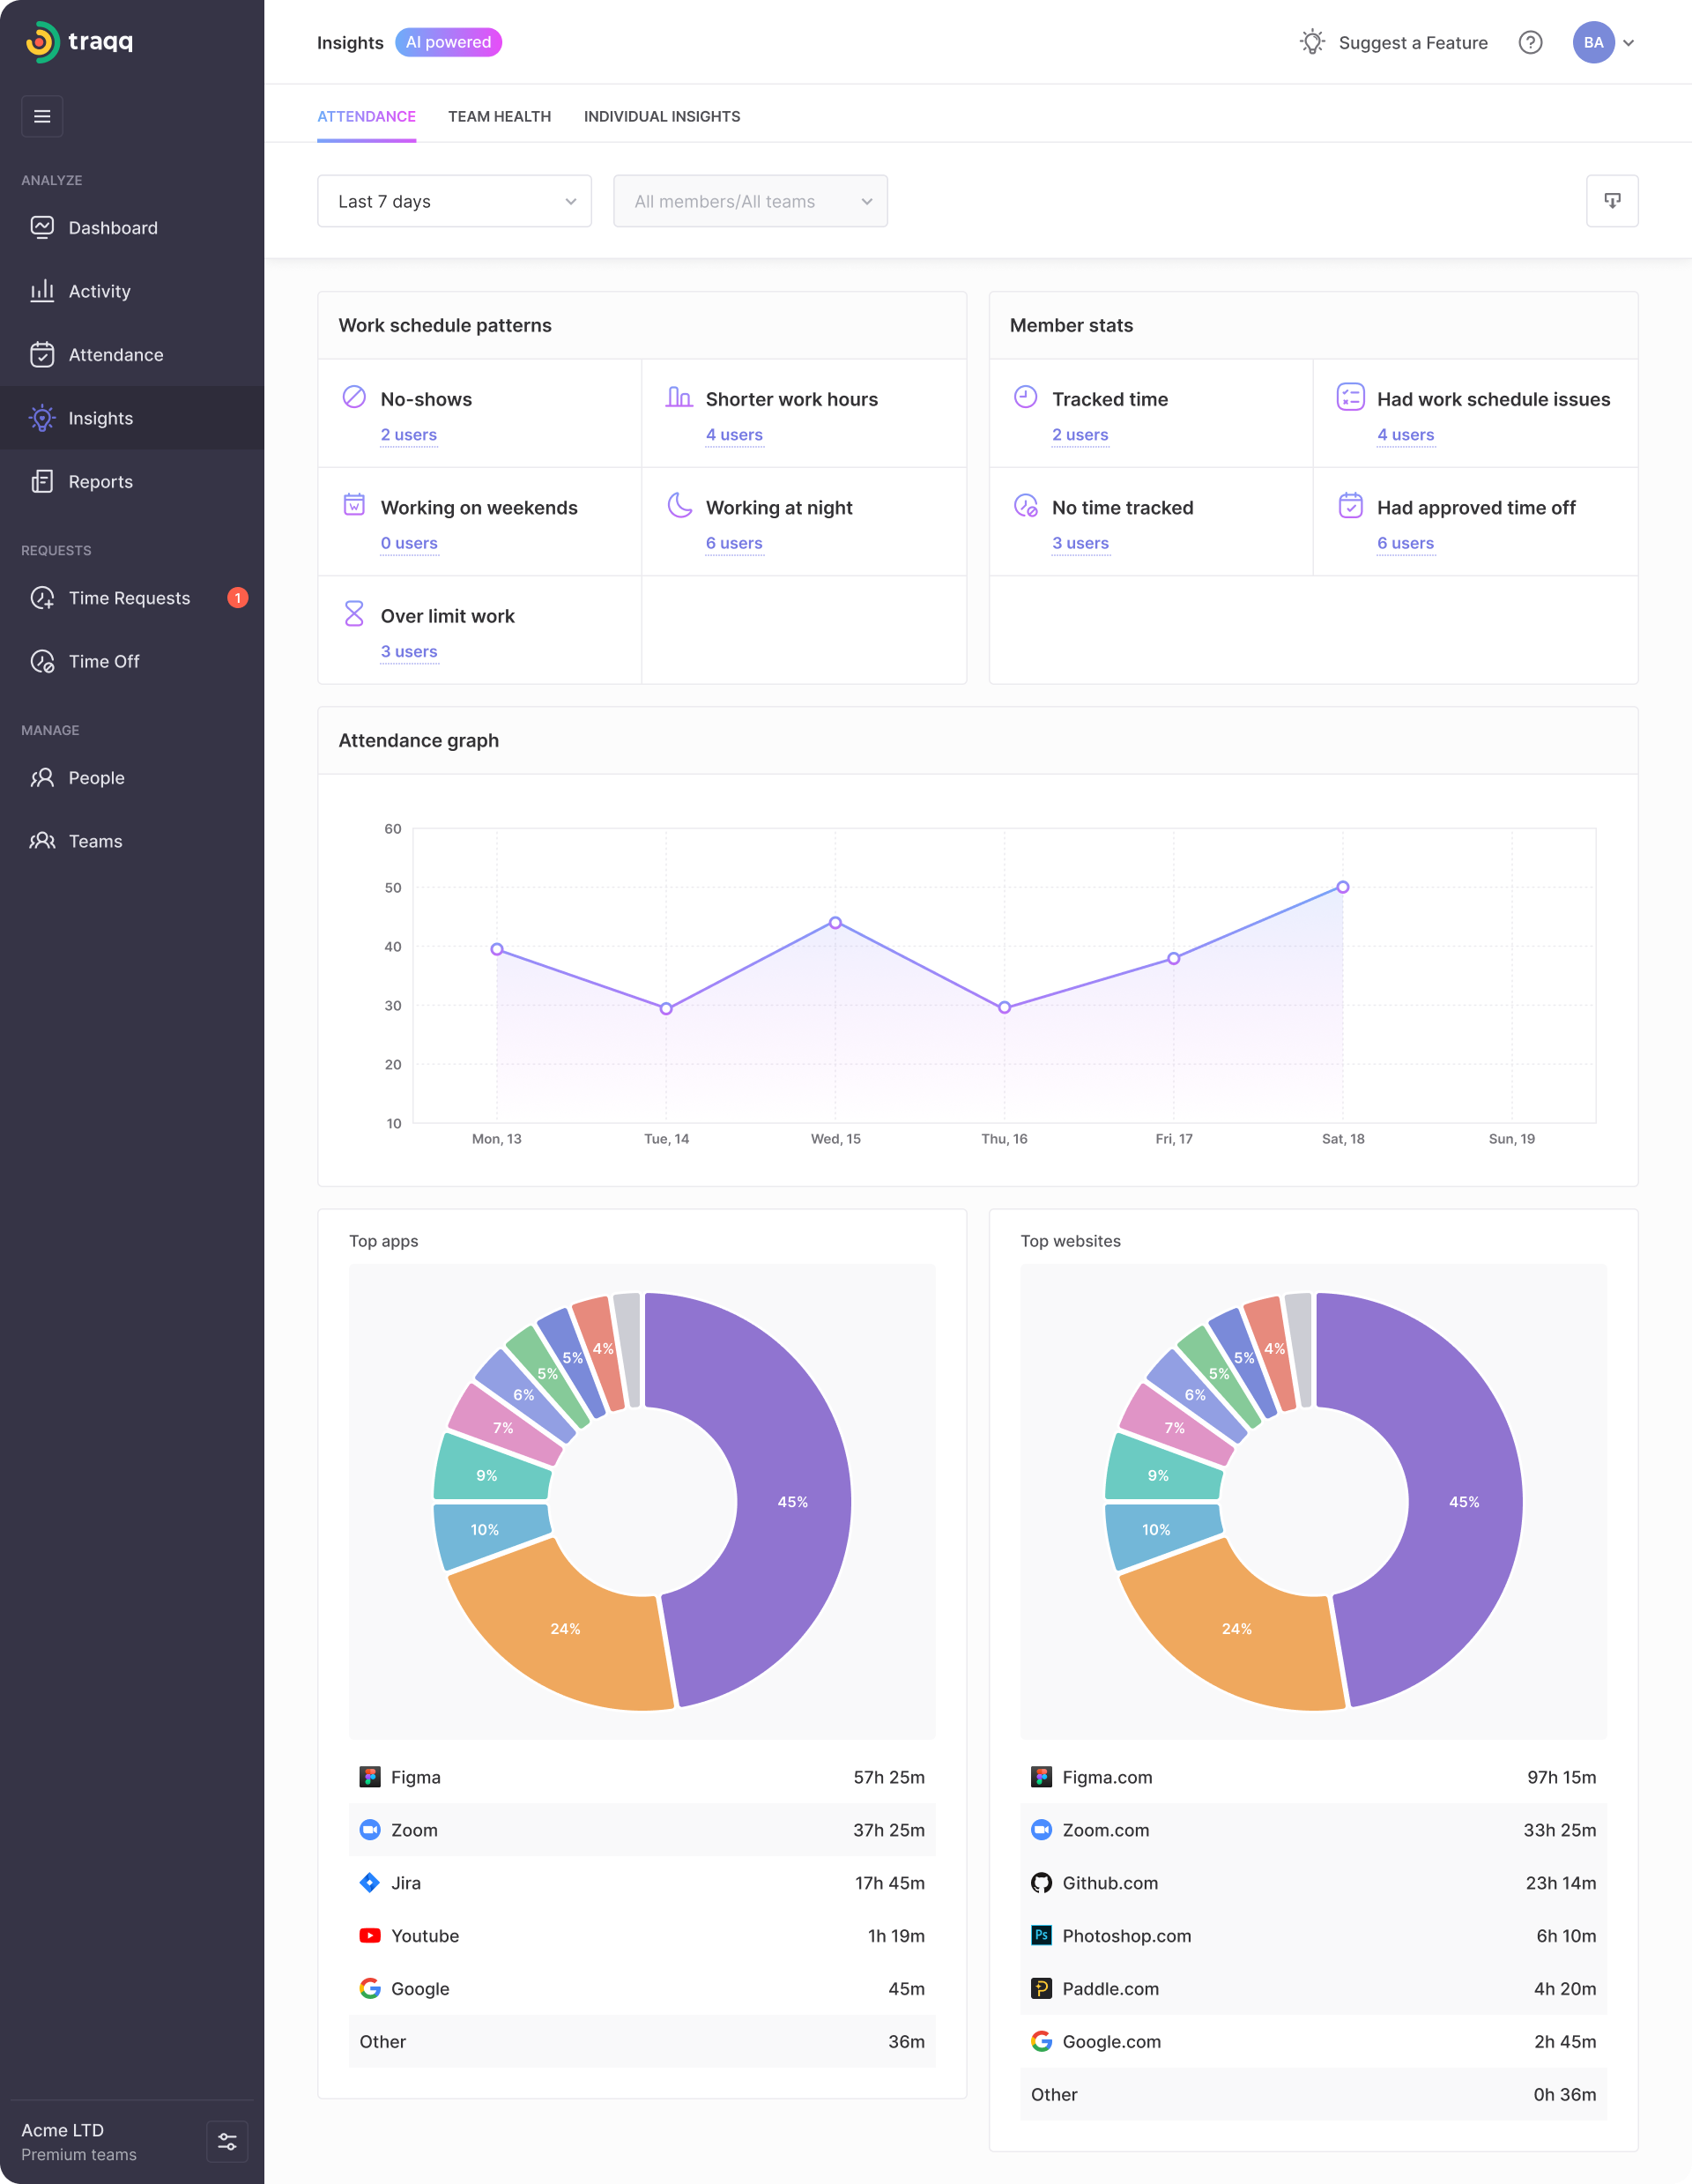
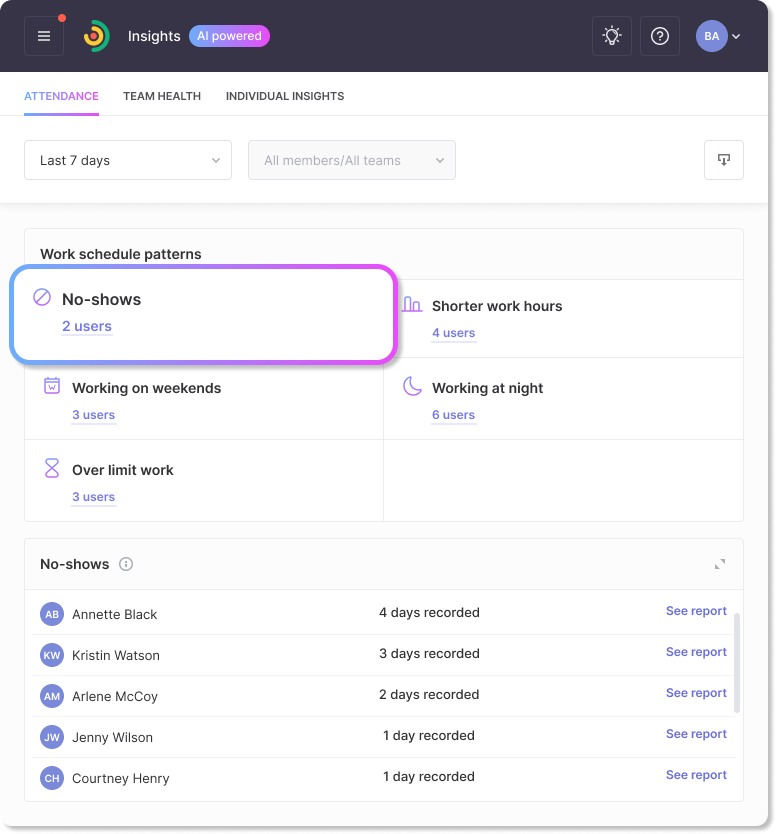
Attendance Insights
Monitor no-shows, work schedule patterns and attendance trends across teams. Identify reliability issues early.
Finally, analytics that don’t just tell me what happened, but what to do next. The predictive suggestions are were a true breakthrough for our work processes.
Carlos V., IT Director (Healthcare)
The Complete Analytics Suite
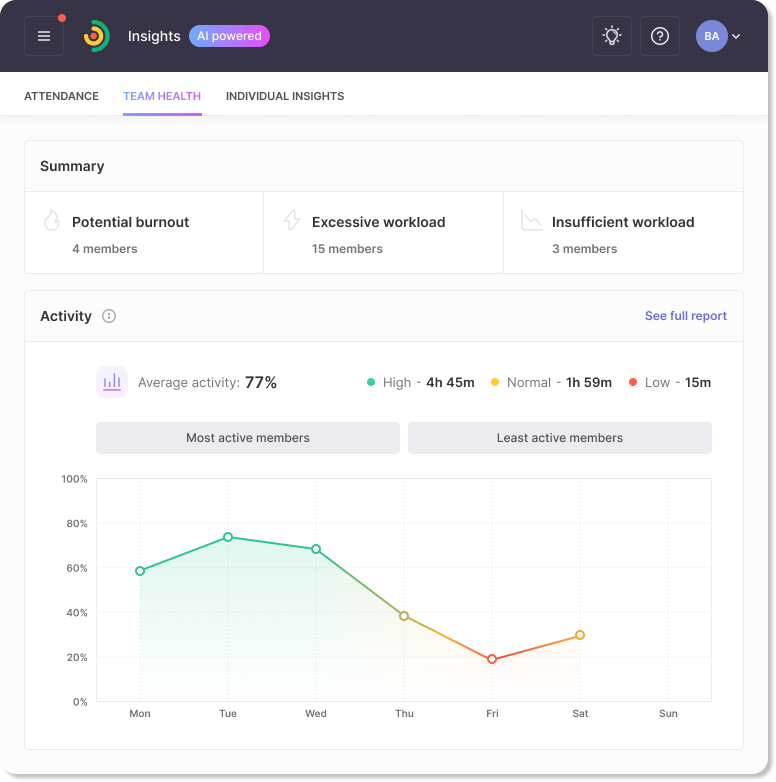
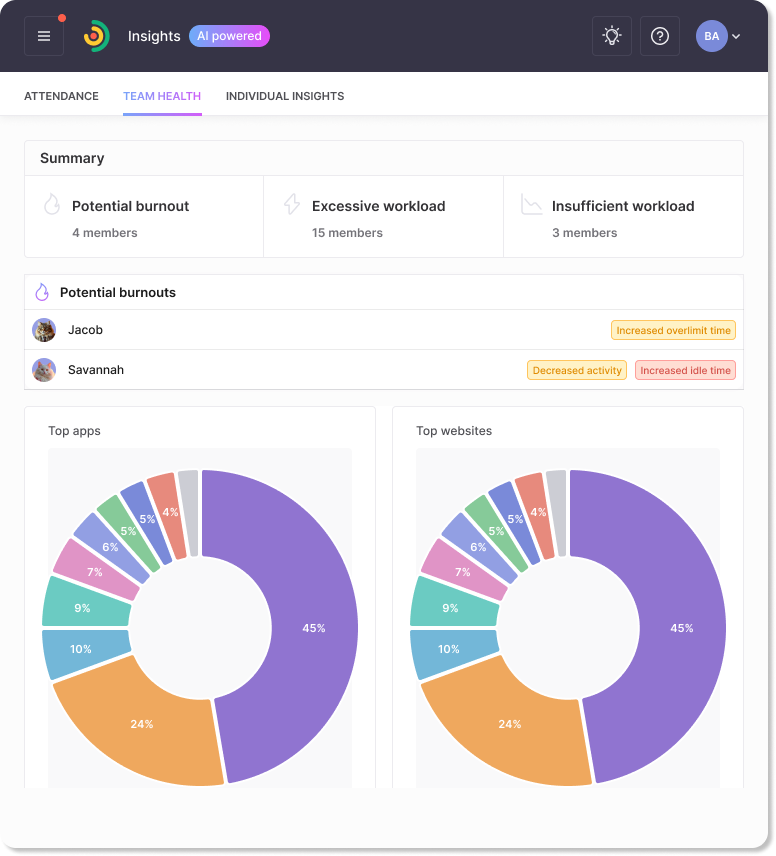
Team Health Dashboard
Your early warning system for team wellbeing:
- Potential Burnout Detection: AI flags employees showing 2+ warning signs
- Workload Analysis: Instantly see who’s overloaded or underutilized
- Engagement Tracking: Monitor activity trends that indicate disengagement
- Break Pattern Analysis: Identify unhealthy work patterns
- Predictive Alerts: Get notified before problems impact performance
Activity Pattern Intelligence
Understand what drives team productivity:
- Productive Time Metrics: See real focused work vs. time online
- Peak Performance Mapping: Identify when teams work best
- Distraction Analysis: Know what’s impacting focus across teams
- Weekly/Daily Patterns: Optimize schedules based on natural rhythms
- Department Comparisons: Benchmark performance across teams
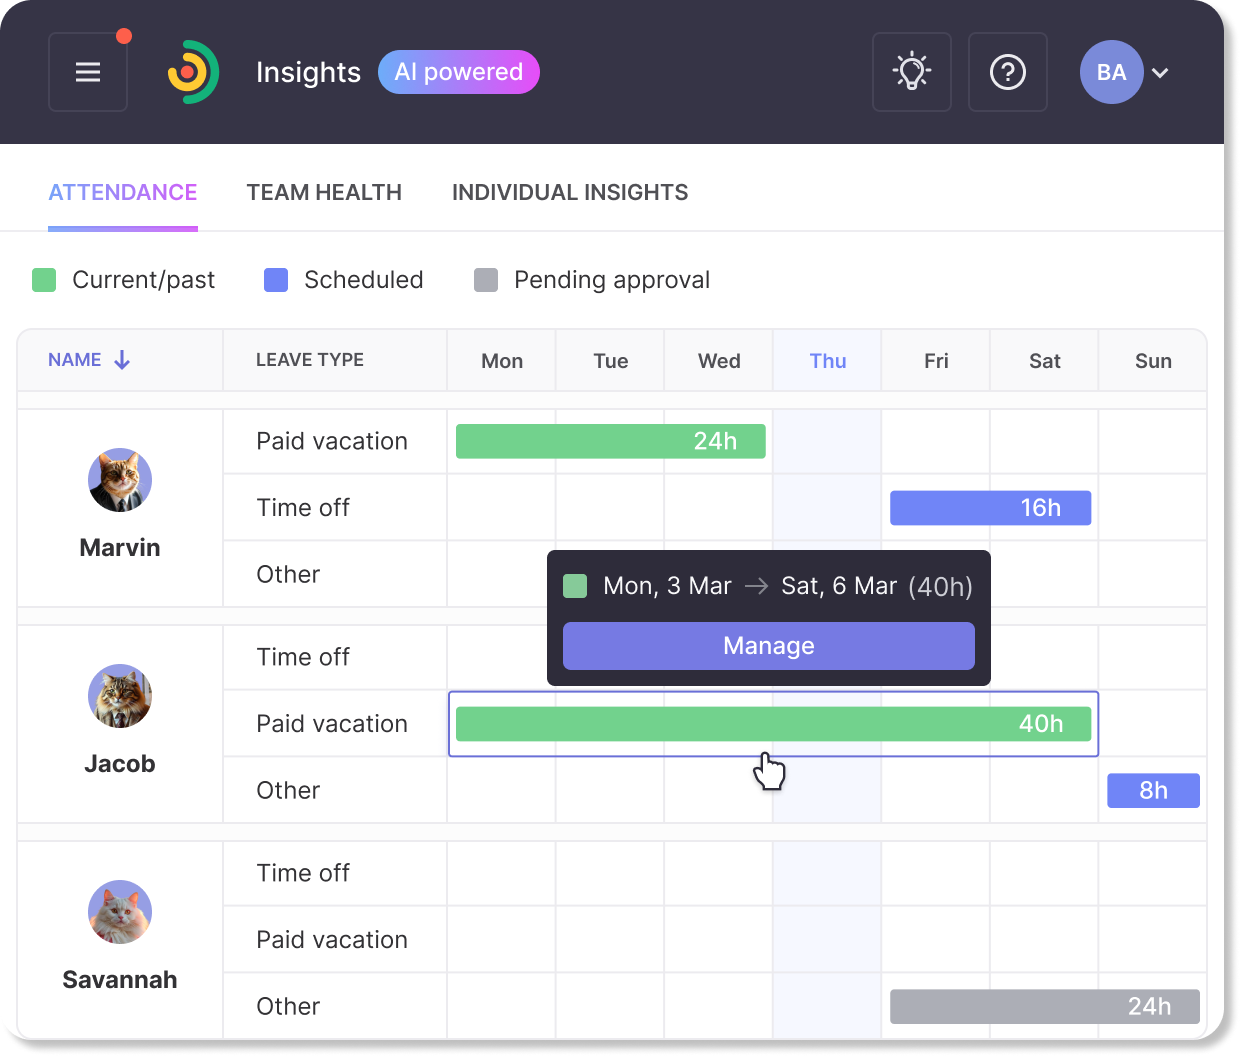
Smart Attendance Analytics
Beyond basic time tracking:
- No-Show Patterns: Identify attendance issues before they escalate
- Schedule Optimization: See who’s working nights and weekends
- Work Hour Analysis: Track underworked days and overtime trends
- Time Zone Intelligence: Manage global teams effectively
- Compliance Tracking: Ensure labor law compliance automatically
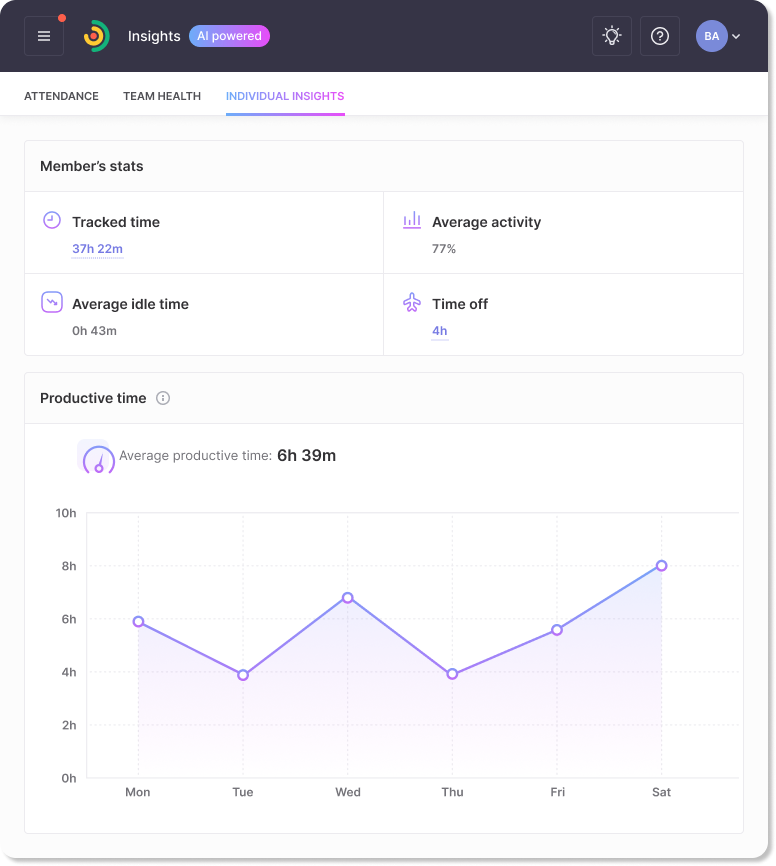
Individual Productivity Hub
Personalized performance optimization:
- Focus time vs. fragmented work analysis
- Energy cycle mapping for schedule alignment
- Distraction source breakdown by app/website
- See how much time is spent on deep work vs. interrupted tasks
- Discover when someone works most effectively (morning vs. afternoon)
- Spot which apps or websites pull attention away from work
- Compare weekly performance to spot improvements or slumps
Schedule and attendance overview:
Smarter attendance tracking:
- See who’s always on time and who struggles with punctuality
- Get absence details – Traqq’s system spots no-show patterns early
- Prevent scheduling mistakes – Get alerts for overtime risks
- Know exactly who’s reliable (and who might need support)
- Get a heads-up when someone’s likely to be absent
- Avoid accidental overtime violations
- Spot scheduling clashes before they cause problems
- Understand how time-off patterns affect your team
Real leaders, real results

Operations Director
“Finally see productivity patterns across our global team. Discovered our Singapore office peaks at different hours than London. Adjusted meeting schedules and saw 30% productivity improvement.”
– David Martinez

Tech Company CEO
“Our AI analytics flagged 5 developers at burnout risk. We redistributed work and prevented losing key talent. The predictive insights alone justify the investment.”
– Michael Williams

HR Leader
“The insufficient workload alerts helped identify underutilized talent. We’ve reassigned 12 people to high-impact projects, improving both engagement and output.”
– Sarah Chen
We reduced overtime-related turnover by 40% in 3 months thanks to Traqq’s workload imbalance alerts.
Marcus T., HR Director (Consulting Firm)
Beyond Basic Reporting
Transform scattered data into strategic intelligence that drives team success.
Traqq’s burnout alerts helped us redistribute workloads before we lost key team members. The AI spotted patterns we’d completely missed.
Priya K., Engineering Manager (Tech Startup)
Customizable for Your Organization
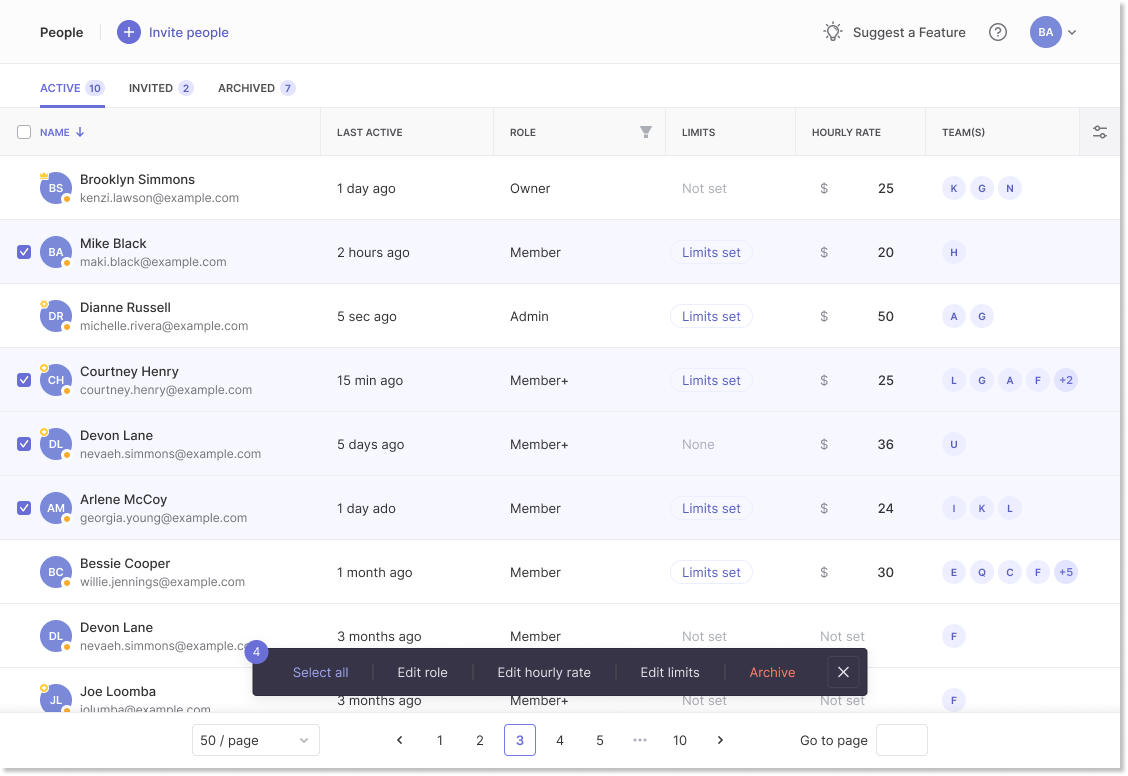
- Flexible Time Periods View insights by last 30 days, last month or last year.. Spot both immediate issues and long-term trends.
- Team-Level Filtering Drill down by department, location, or custom teams. Compare performance across different groups.
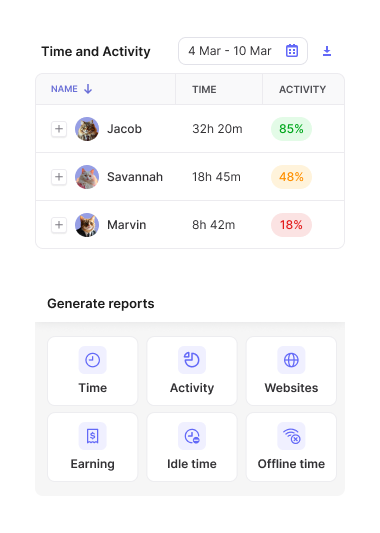
- Export Everything Download dashboards as PDF or XLSX files for presentations, compliance or offline analysis. Schedule daily, weekly or monthly reports and auto-send to HR, managers or stakeholders.
- Workload Safeguards Set custom working hours for individual workers and enforce daily or weekly work limits to prevent burnout
More than just AI insights
Traqq helps you understand and improve every aspect of your workday:
The rest of Traqq’s online productivity tools
Whether you want to quickly convert decimal hours to regular time or calculate your overtime pay, our suite of online tools has you covered.
Frequently Asked Questions
How does AI-powered analytics differ from regular reporting?
Our AI identifies patterns, predicts problems, and provides actionable recommendations. Regular reports just show historical data – AI analytics help you prevent issues before they impact performance.
What data does the AI analyze?
Activity patterns, application usage, work schedules, idle time, and productivity metrics. No keylogging, no screenshots – just pattern analysis that respects privacy while delivering insights.
How accurate is burnout prediction?
Our AI flags potential burnout with 85% accuracy by analyzing multiple indicators: weekend work, overtime patterns, activity changes, and idle time increases. Early detection helps prevent actual burnout.
How long until we see meaningful insights?
Basic patterns emerge within days. Full AI insights with predictive capabilities are available after 30 days of data collection.
How does this work for remote/hybrid teams?
Perfectly. AI analytics work regardless of location, providing unified intelligence for distributed teams while respecting timezone differences.
What’s included in each insight category?
Three categories: Attendance (work patterns), Team Health (burnout/workload), Activity Patterns (productivity).
Can managers see individual employee data?
Managers see team aggregates and can drill down to individual insights for their direct reports. This balances privacy with necessary oversight.
How do we handle data privacy concerns?
All analysis is pattern-based without invasive monitoring. No screenshots or keylogging. Data is encrypted and compliant with privacy regulations.
Can we export data for presentations?
Yes. Some of the dashboards and reports can be exported as PDF or XLSX files with full formatting, perfect for board meetings or stakeholder updates.
What ROI can we expect?
Clients typically see 20-30% productivity improvements, 40% reduction in burnout-related turnover, and 25% better project delivery rates within 6 months. If you want to find out in detail, calculate your savings with Traqq’s Savings Calculator.
Is there an API for custom integrations?
Currently, insights are available through our web dashboard and PDF exports. API access is on our roadmap for Traqq 2.0 app.