Costs, revenue & profit report
Traqq provides several ways to review financial data across your workspace. You can analyze revenue, cost, and profit from the Dashboard, Reports section, and individual project pages.
Financial data is calculated based on tracked time, billable settings, user rates, and project-related costs.
Depending on what level of detail you need, you can:
- - Review overall financial performance across the workspace
- Compare revenue and cost across projects, teams, clients, and users
- Analyze financial data for a specific project
- Review detailed time entries with associated revenue and cost -
Dashboard
- The Dashboard allows you to review financial information for a specific project. To access it, open the Dashboard section from the left sidebar and switch to the Money tab.
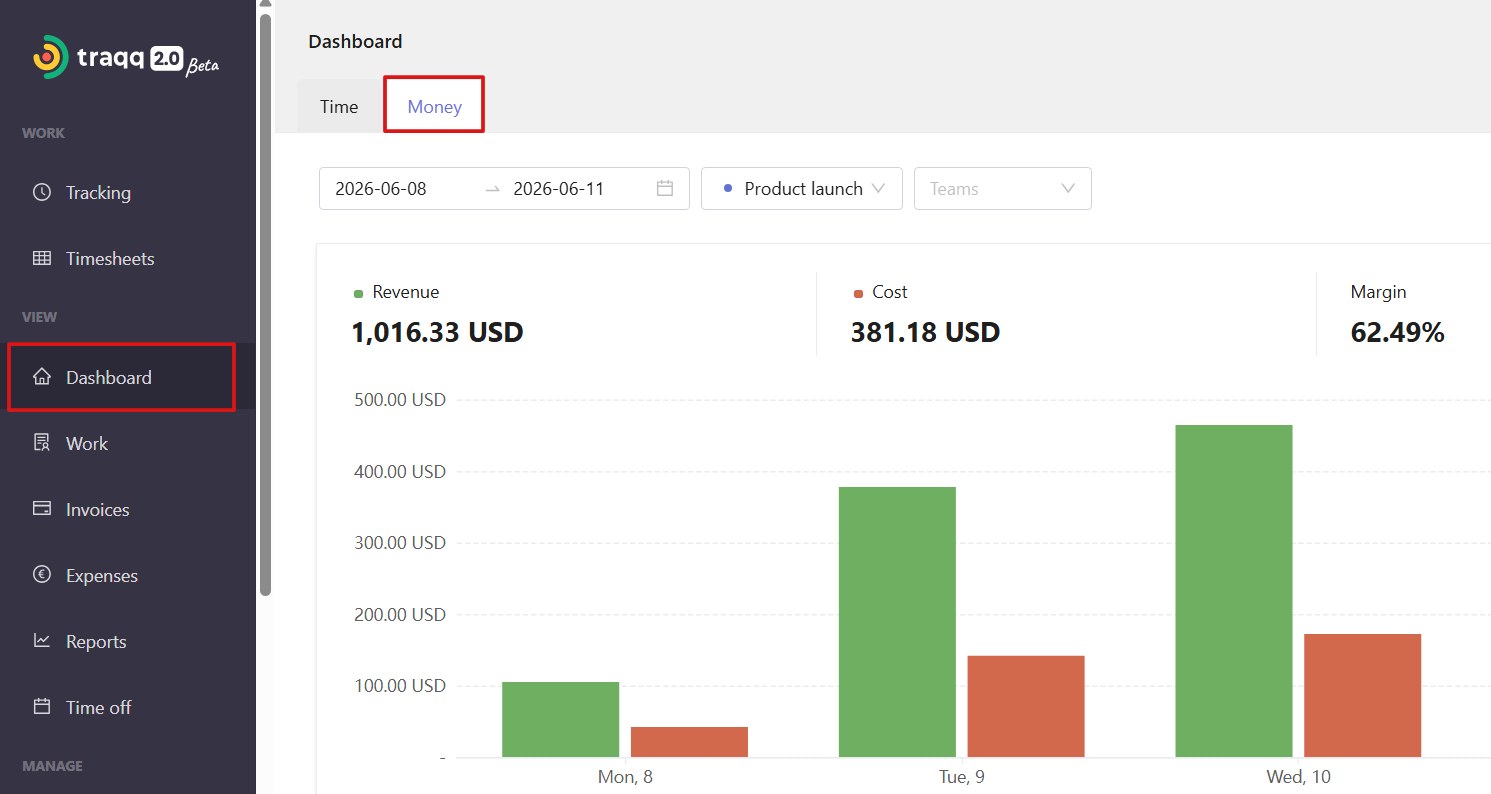
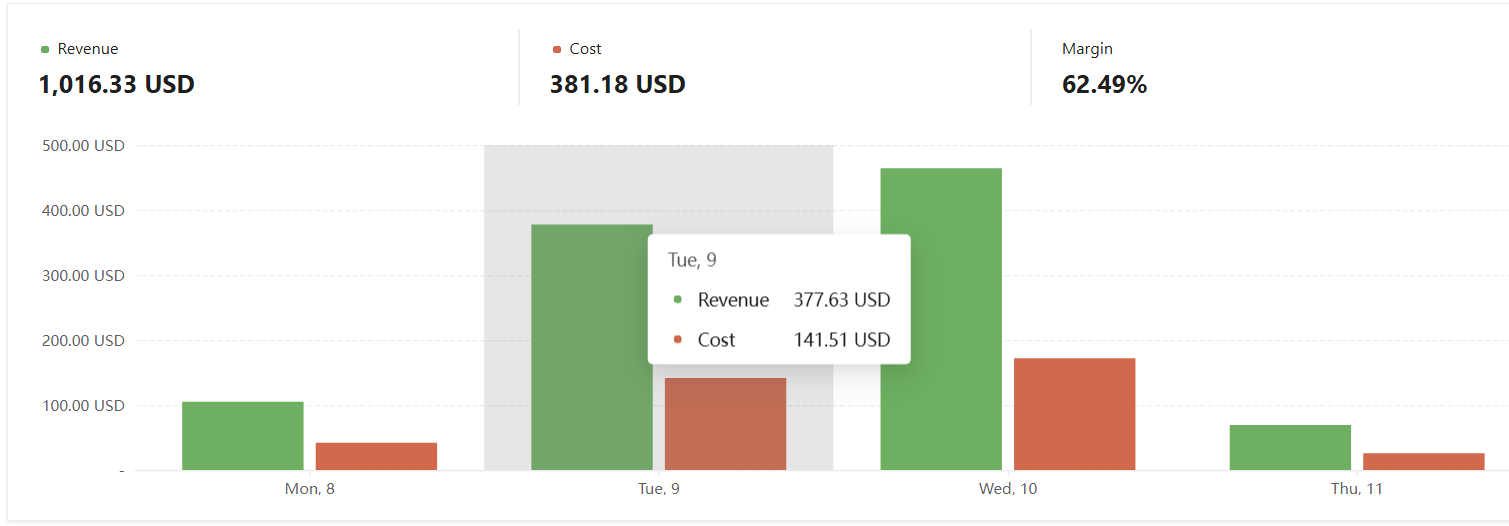
- At the top of the page, you can see total revenue, cost, and margin. A bar chart below shows how revenue and costs are distributed across the selected time period.
- You can filter data by:
- - Date range
- Project
- Teams - Hover over the chart to see revenue and cost for a specific day.
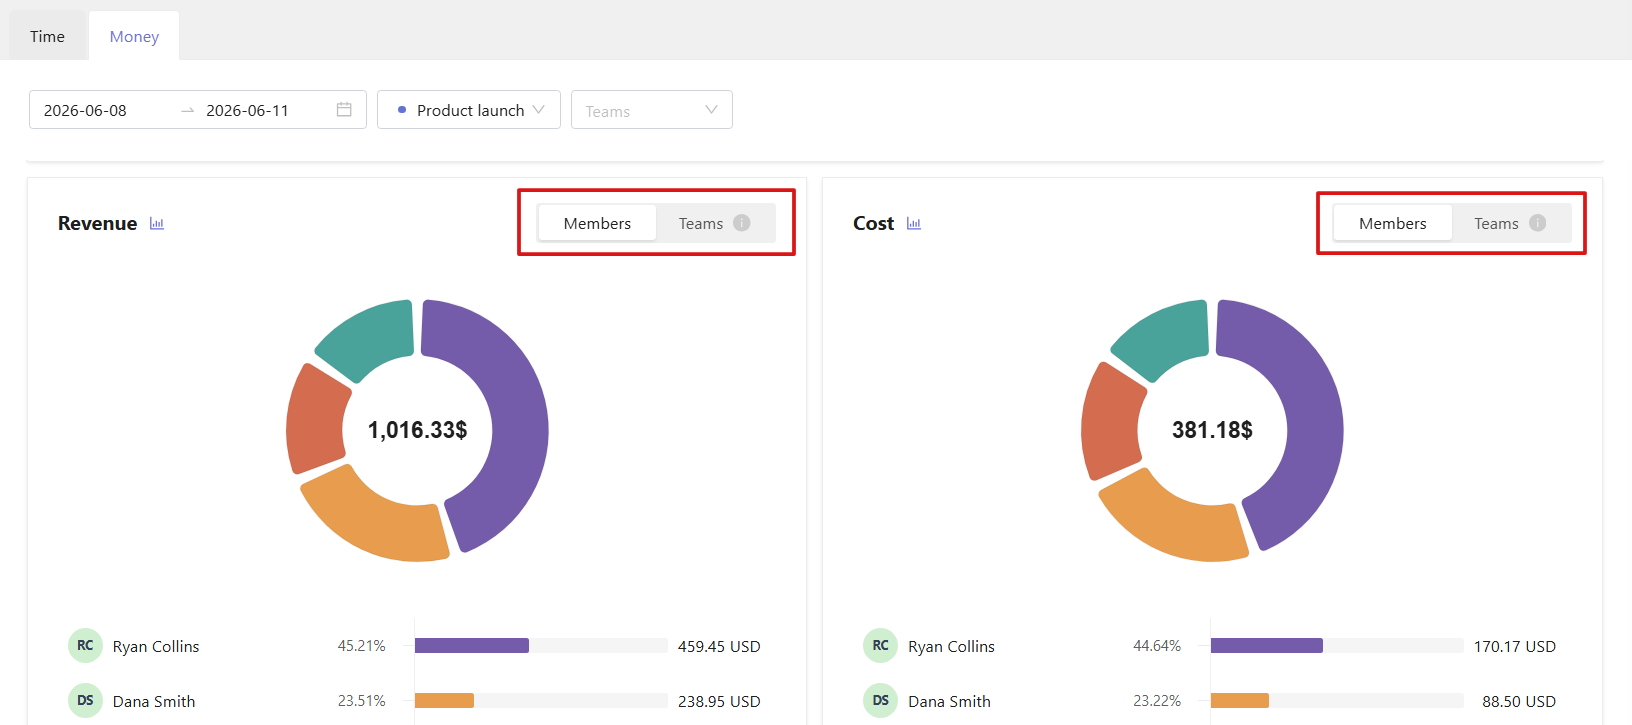
- Below the chart, pie charts show how revenue and cost are distributed across members and teams.
-
Reports
- The Reports section provides more detailed financial analysis based on tracked work. To access it, open the Reports section from the left sidebar and select the Time tab.
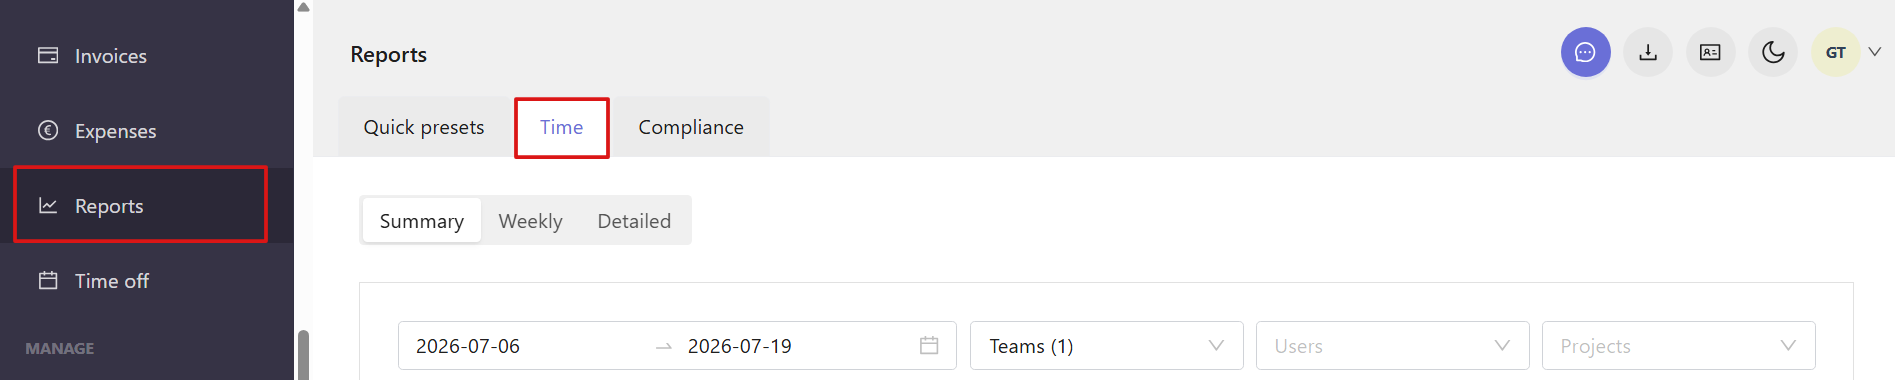
- The report includes three views:
- - Summary
- Weekly
- Detailed 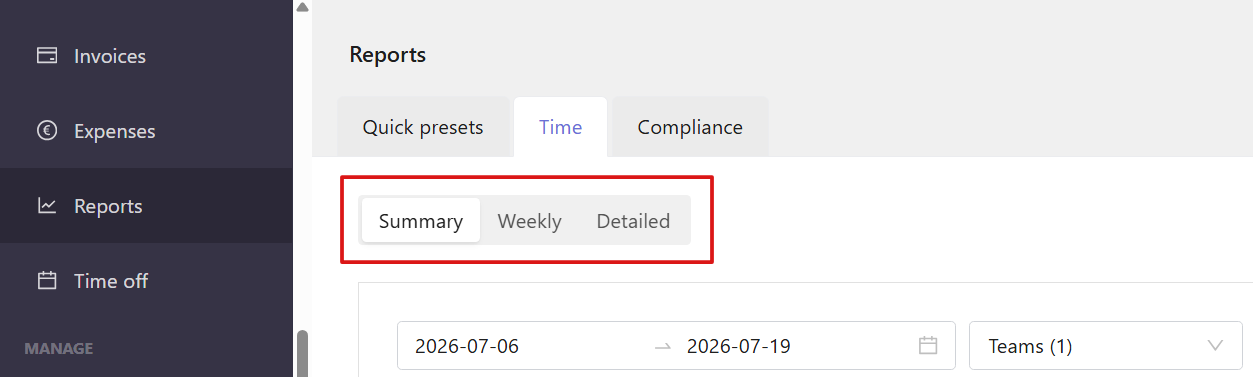
-
Summary view
- The Summary tab helps you analyze financial data across projects, teams, clients, and users for the selected period.
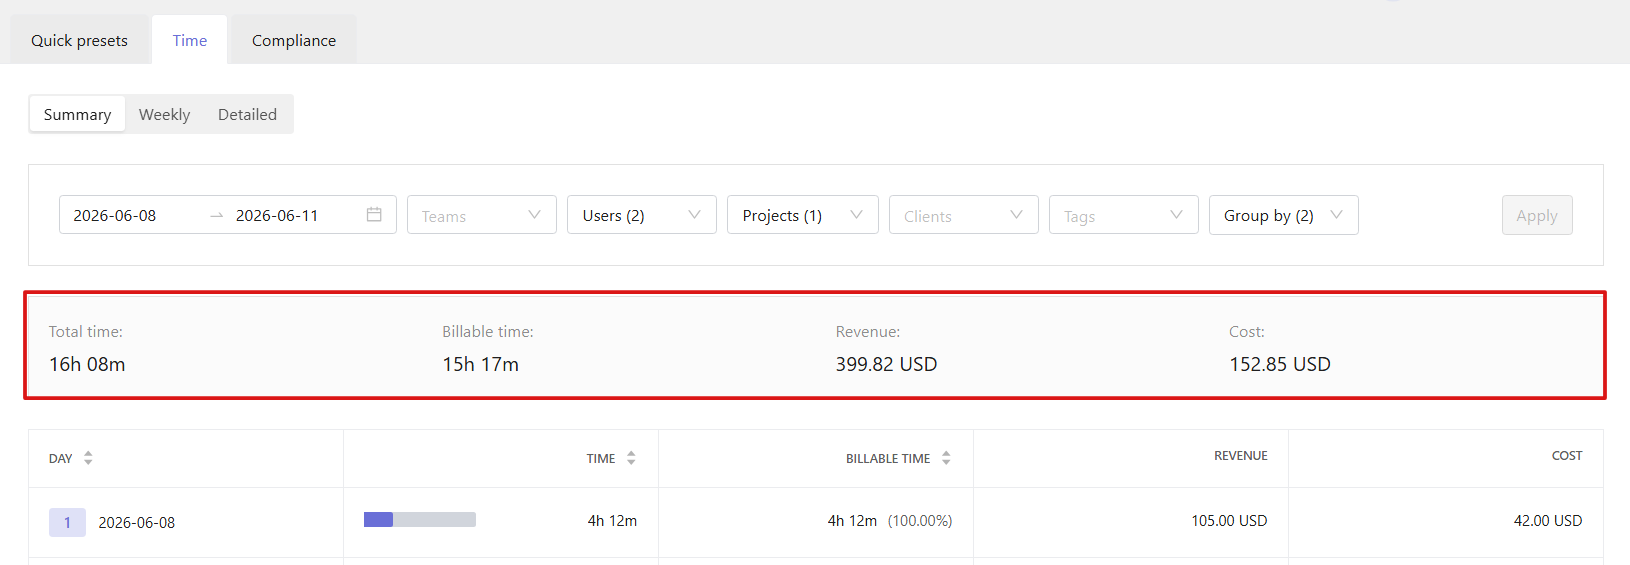
- You can filter the report by date range, teams, users, projects, clients, and tags. After setting filters, click Apply to update the report.

- The Group by option allows you to organize financial data in different ways.

- Available grouping options include:
- - Day
- Week
- Month
- User
- Team
- Project
- Client
- Tag - You can also apply multiple grouping levels. For example, grouping by Team → Month → Project first organizes data by team, then breaks it down by month, and finally by project within each month. Each level can be expanded by clicking on it. In this example, click a team name to view months, and then click a month to view projects.
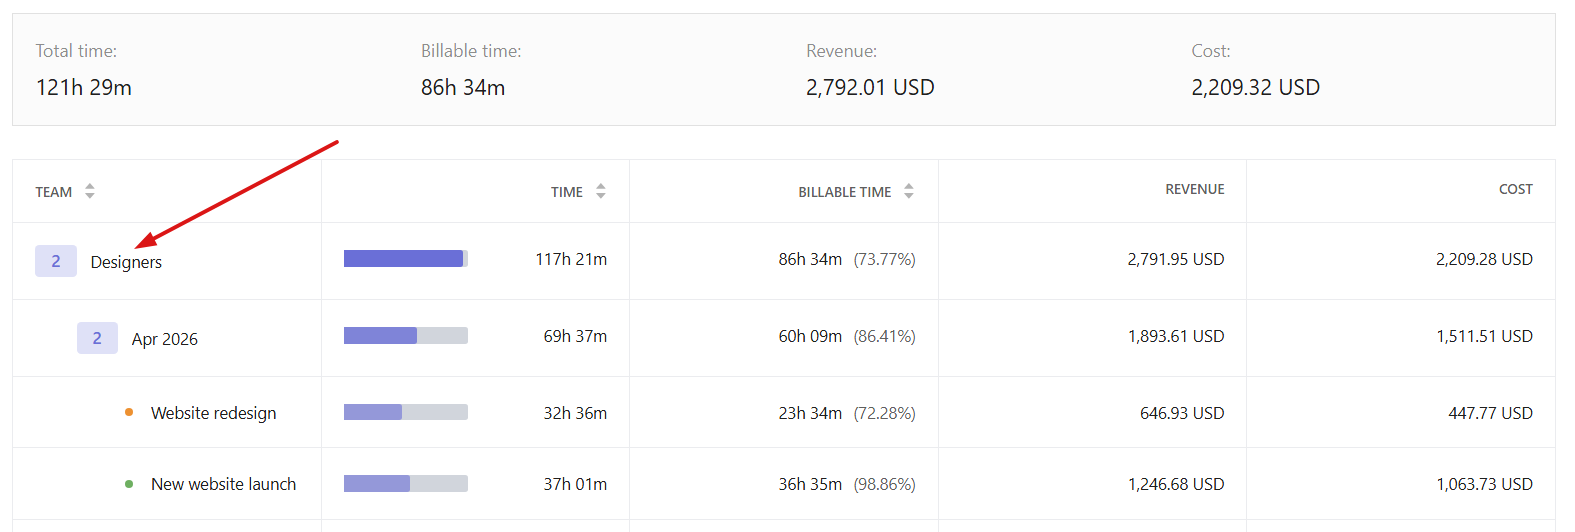
- At the top of the report, you can see total tracked time, billable time, revenue, and cost for the selected filters.
- The table below the summary shows a breakdown for tracked time, billable time, revenue, and cost.
-
Weekly view
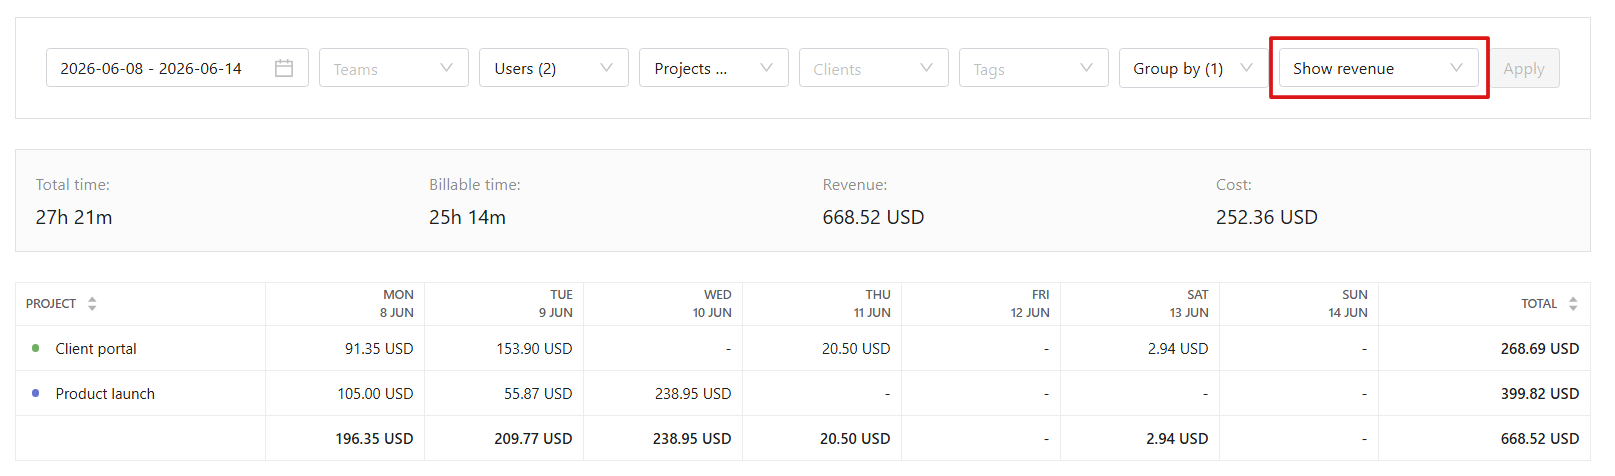
- The Weekly tab shows how financial results change throughout the week.
- You can filter the report by teams, users, projects, clients, and tags and group data by project, client, team, or user.

- You can also switch between different metrics to focus on specific data, including revenue, cost, and profit.
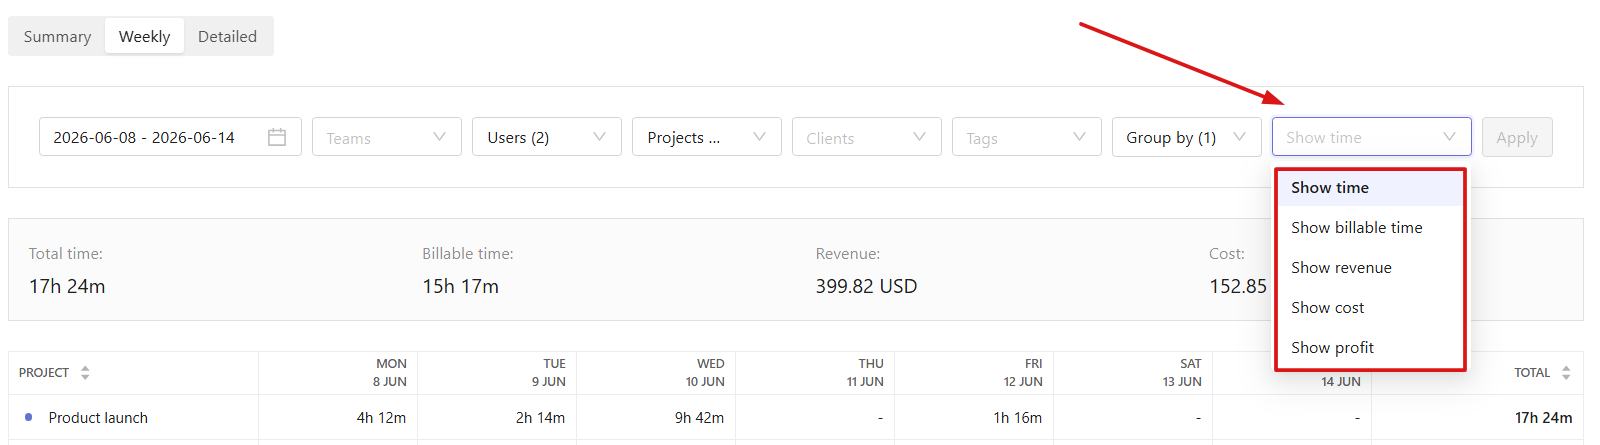
- For example, you can choose Show revenue and analyze revenue across the week, along with daily and weekly totals.
-
Detailed view
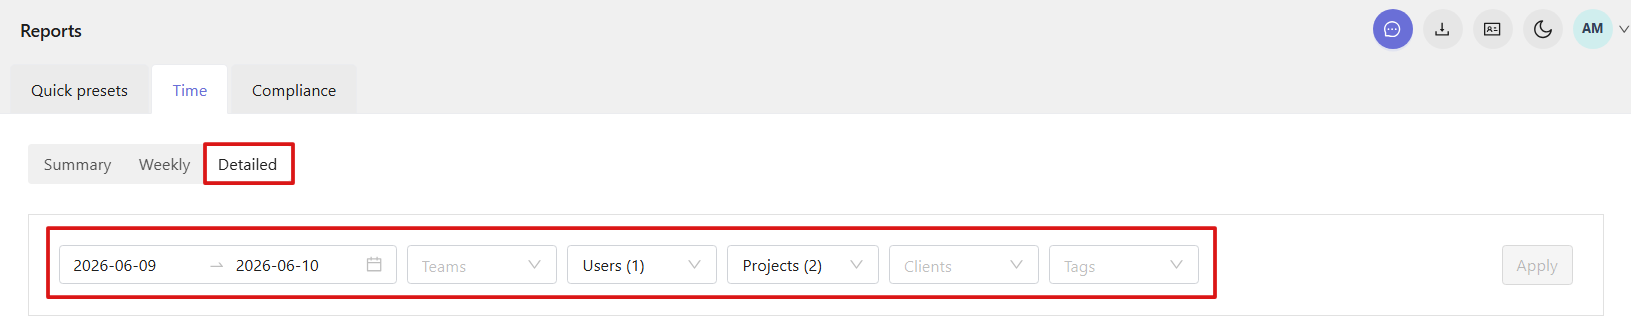
- The Detailed tab provides a breakdown of individual time entries with financial data. You can use filters to narrow results by date range, users, teams, projects, clients, and tags.
- Each row includes:
- - Project name
- Task description and tags
- User
- Task date and start time
- Duration
- Revenue
- Cost 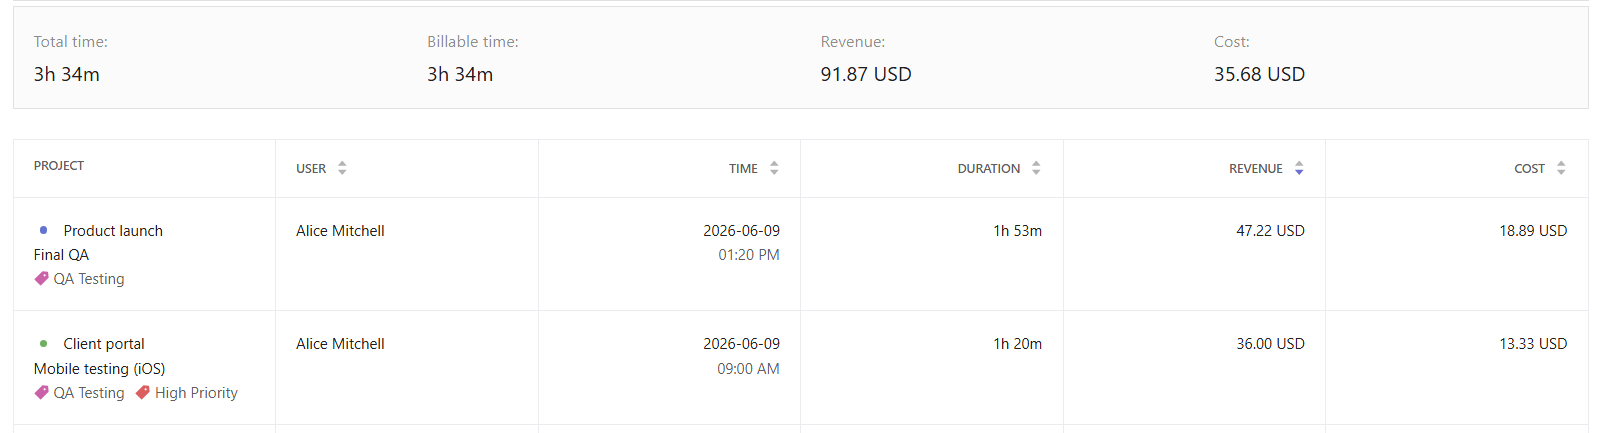
-
Project financial data
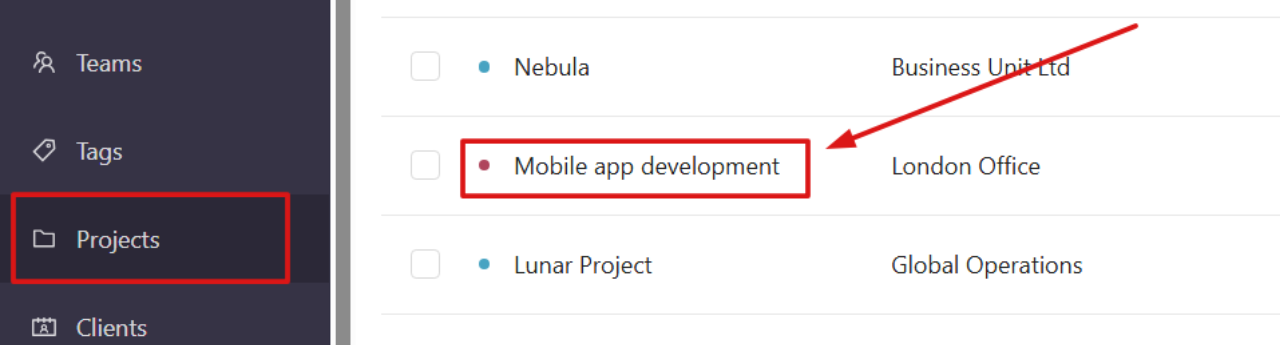
- You can also review financial information for individual projects from the Projects section.
- Open the Projects section from the left sidebar and click a project name to open its profile.
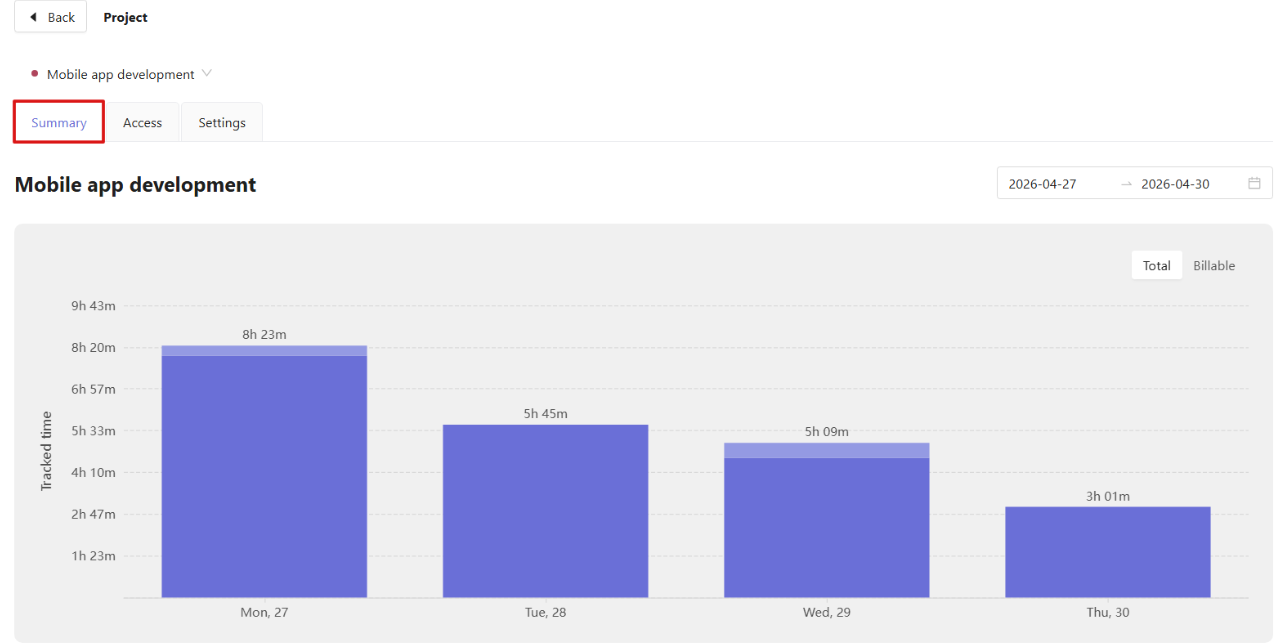
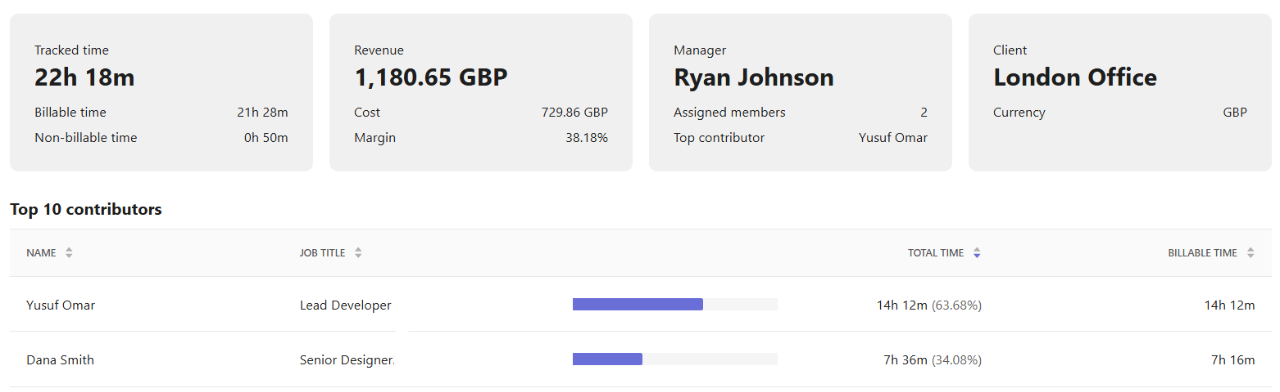
- The Summary tab displays project-related financial metrics, including:
- - Revenue
- Cost
- Margin
- Total tracked time
- Billable and non-billable time - The chart at the top of the page shows how tracked time is distributed across the selected period, helping you compare work activity with financial results.
- You can also review:
- - Top contributors
- Distribution of tracked work across the project
- Billable time per user