Workload analysis
The Workload analysis section helps you understand workload distribution across your team and compare tracked time with planned capacity.
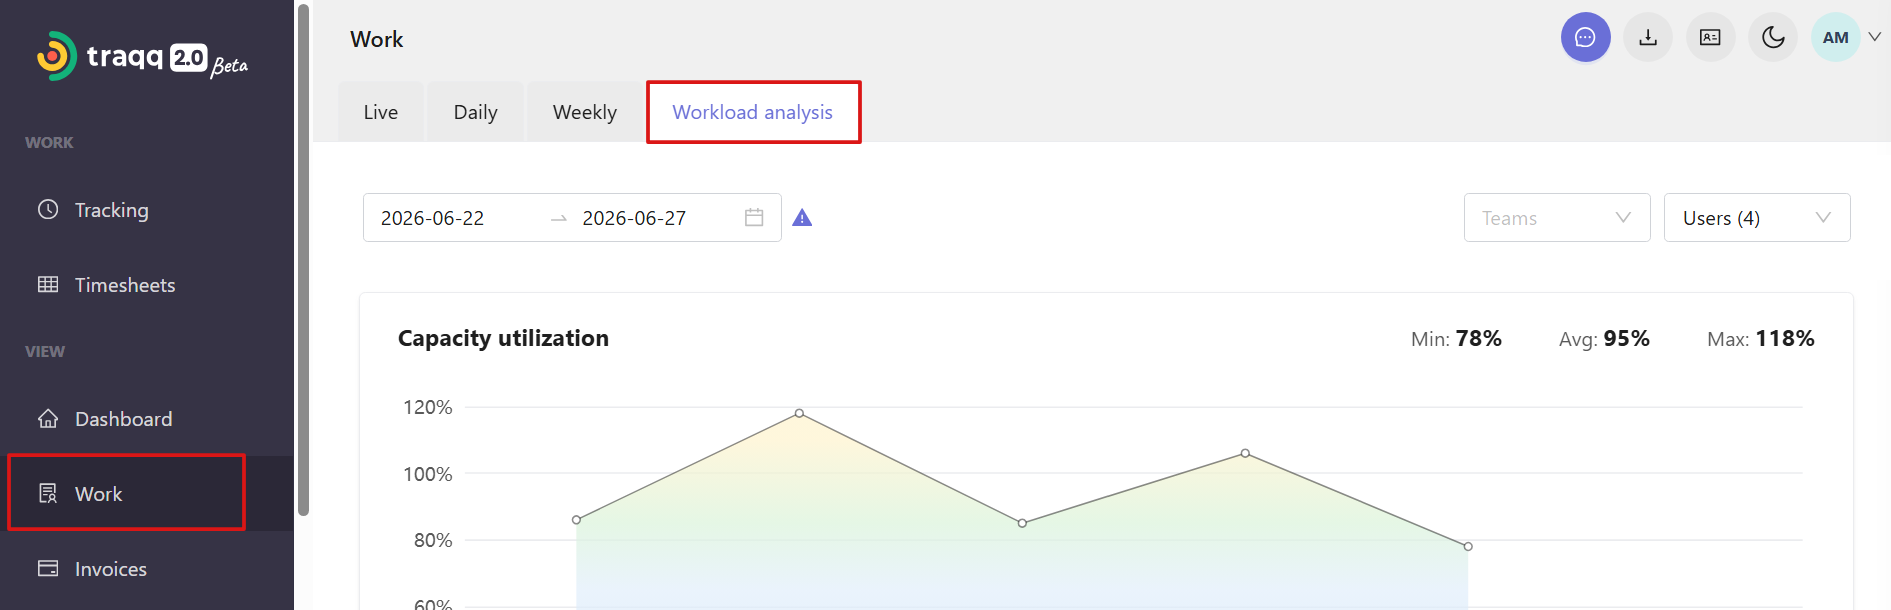
To access it, open Work from the left sidebar and select Workload analysis.
Before reviewing workload insights, make sure the correct capacity is set for all selected team members. For more information, see Setting individual working schedules and capacity.
Filters
You can filter workload data by:
- - Date range
- Teams
- Users 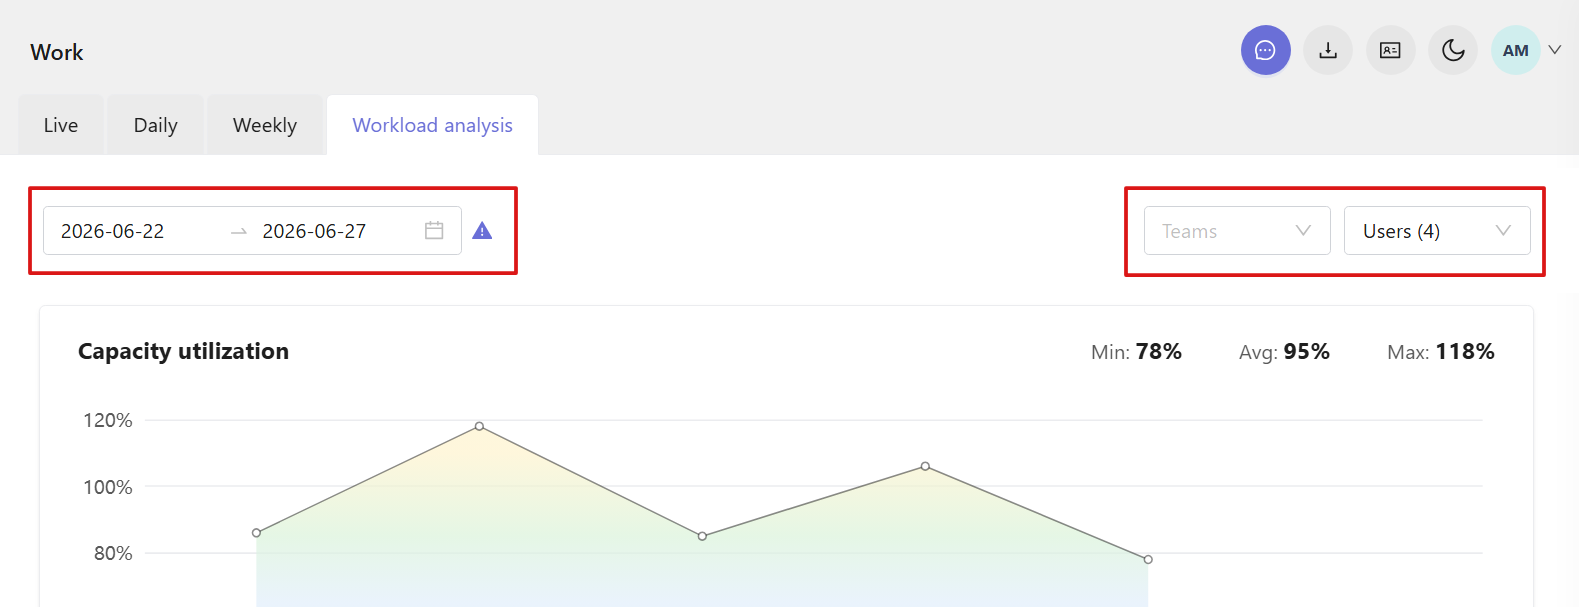
Capacity utilization
The Capacity utilization chart shows how capacity usage changes over the selected period for the selected teams or users.
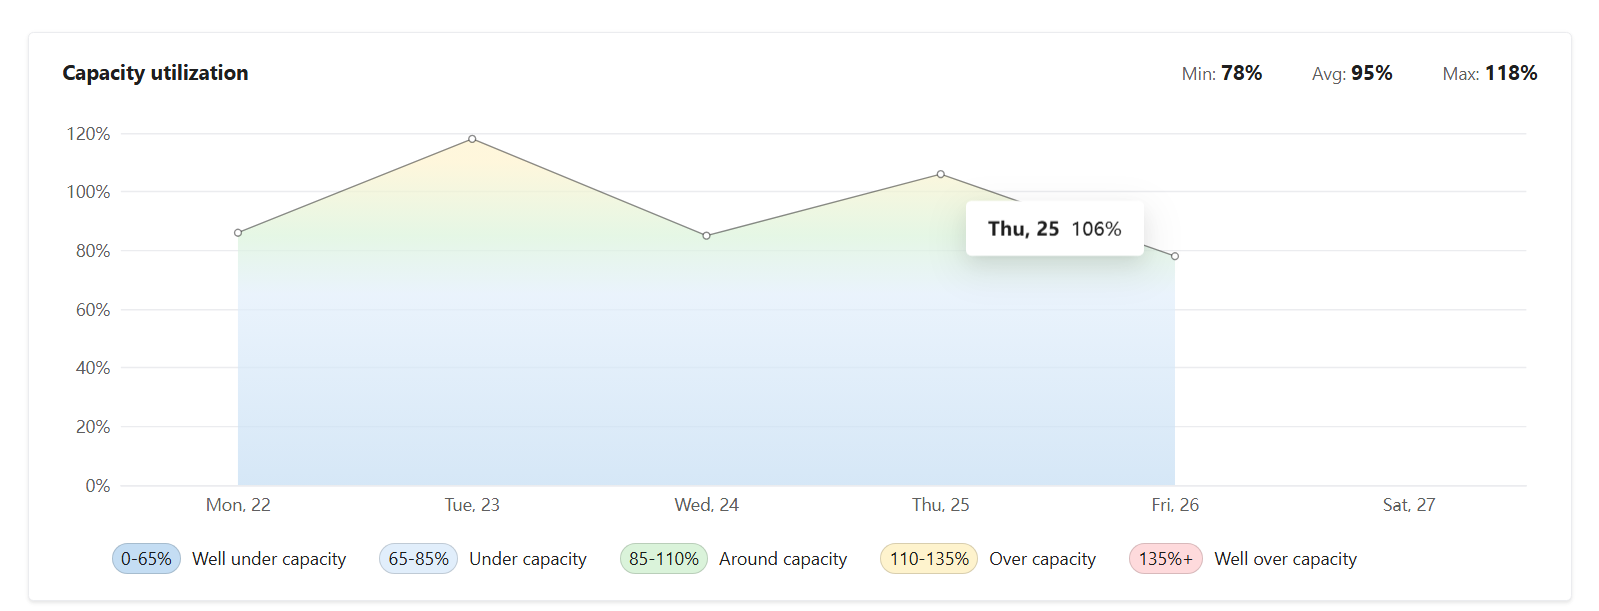
Capacity usage is grouped into the following ranges:
0–65% — Well under capacity
65–85% — Under capacity
85–110% — Around capacity
110–135% — Over capacity
135%+ — Well over capacity
Capacity usage heatmap
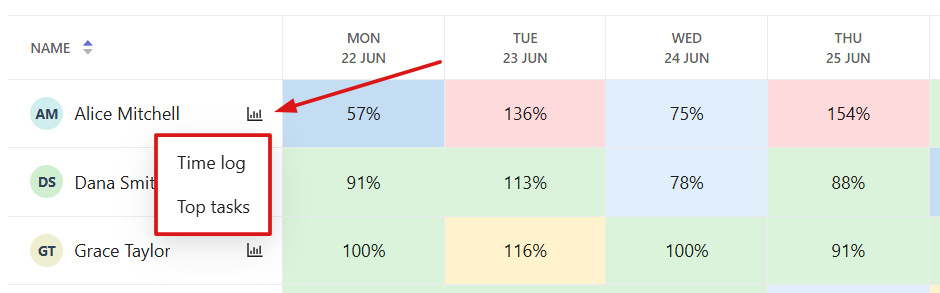
The Capacity usage heatmap shows the percentage of capacity used by each team member on each day. Each cell is color-coded based on the capacity range.
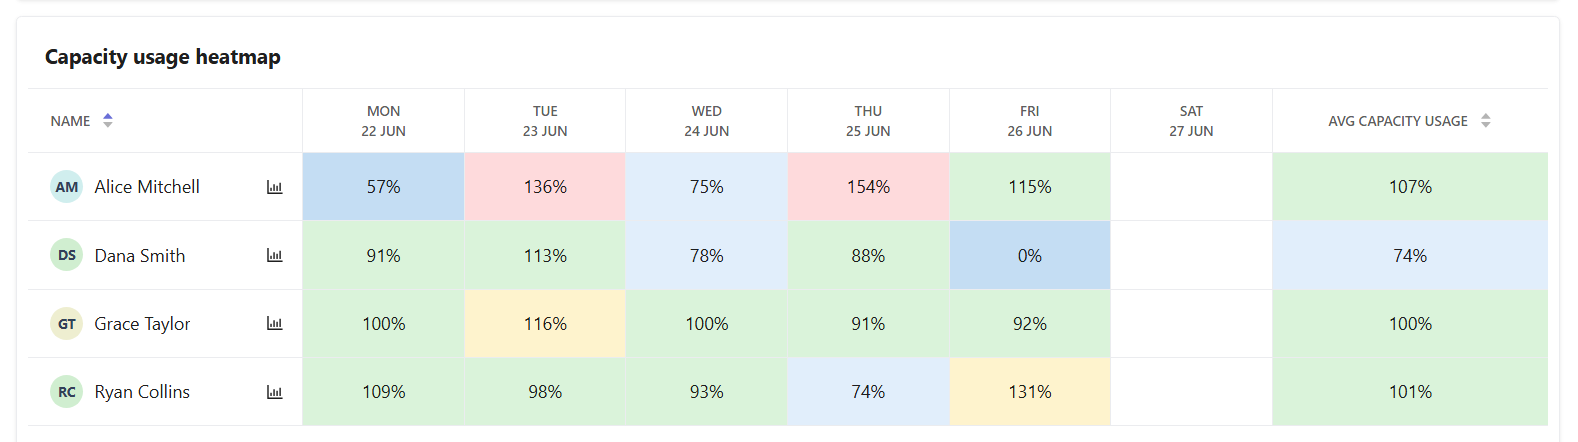
For each user, you can open additional options to view:
Time log — opens the user's tracked time details.
Top tasks — opens information about the user's most time-consuming tasks.
Team balance
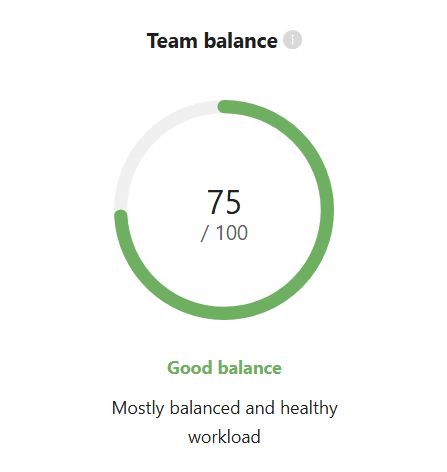
The Team balance section shows how evenly workload is distributed across selected team members.
A higher score means that more team members are working within their optimal capacity range.
The balance score includes one of the following summaries:
Poor balance — Workload is unevenly distributed across the team.
Moderate imbalance — Workload is moderately uneven.
Good balance — Mostly balanced and healthy workload.
Excellent balance — Workload is evenly distributed across the team.
Workload distribution
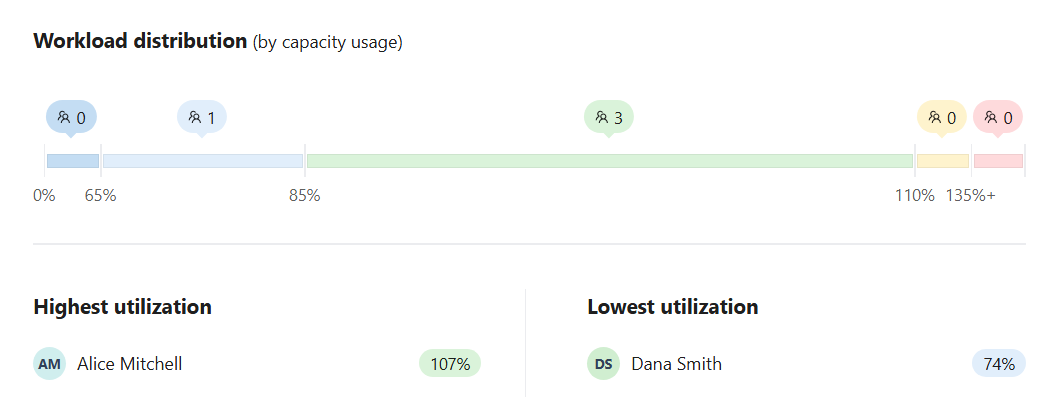
The Workload distribution chart shows how many team members fall into each capacity range.
It helps you understand workload distribution across the team and identify users with the highest and lowest capacity utilization.
The section also highlights:
Highest utilization — team members with the highest capacity usage.
Lowest utilization — team members with the lowest capacity usage.
FAQs
What does capacity utilization mean in Traqq?
Capacity utilization shows how much time a user has tracked compared to their planned working capacity. It helps you see whether a user is working below, within, or above their expected capacity.
How does Traqq measure workload balance?
Traqq measures workload balance by comparing capacity utilization across team members. It helps identify whether workload is evenly distributed or if some users have too much or too little work.
Why is a user shown as over or under capacity?
A user is shown as over capacity when their tracked time is higher than their planned capacity for the selected period. A user is shown as under capacity when their tracked time is lower than their planned capacity.