Understanding and enhancing employee productivity is a key aspect of organizational success.
This article will guide you through the process of utilizing software-based productivity reports for a precise analysis of employee performance. We’ll explore why these reports are crucial for a thorough and efficient assessment of productivity.
Additionally, we’ll highlight top software solutions for automatically generating these insightful reports, streamlining the process of monitoring and enhancing team productivity. Whether you’re a seasoned manager or new to team leadership, this guide offers valuable insights for optimizing your team’s performance.
What Is an Employee Productivity Report?
An employee productivity report is a tool used by managers to assess and monitor the performance and efficiency of their team members. These reports typically provide detailed insights into various aspects of an employee’s work, such as:
- Time allocation: How much time employees spend on specific tasks or projects.
- Output and achievement: Quantifiable results like sales numbers, completed tasks, or customer interactions.
- Quality of work: Indicators of the work quality, which might include error rates or client feedback.
The primary objective of these reports is to offer a comprehensive view of an employee’s performance, highlighting areas of strength and opportunities for improvement.
These reports can be generated through various means, including automated time-tracking software or manual recording methods. The key is to ensure accuracy and consistency in data collection to provide a reliable basis for performance assessment and decision-making regarding productivity improvements.
Employee Productivity Reports in Dedicated Software
Dedicated software solutions have become indispensable for monitoring and enhancing employee performance. These specialized tools provide detailed reports that give invaluable insights into employee performance and behavior during work hours. Let’s delve into the key components of productivity reports provided by Traqq online time reporting system:
Activity levels
Activity level tracking is a core feature of employee tracking software. It measures the active engagement of employees with their work tasks.
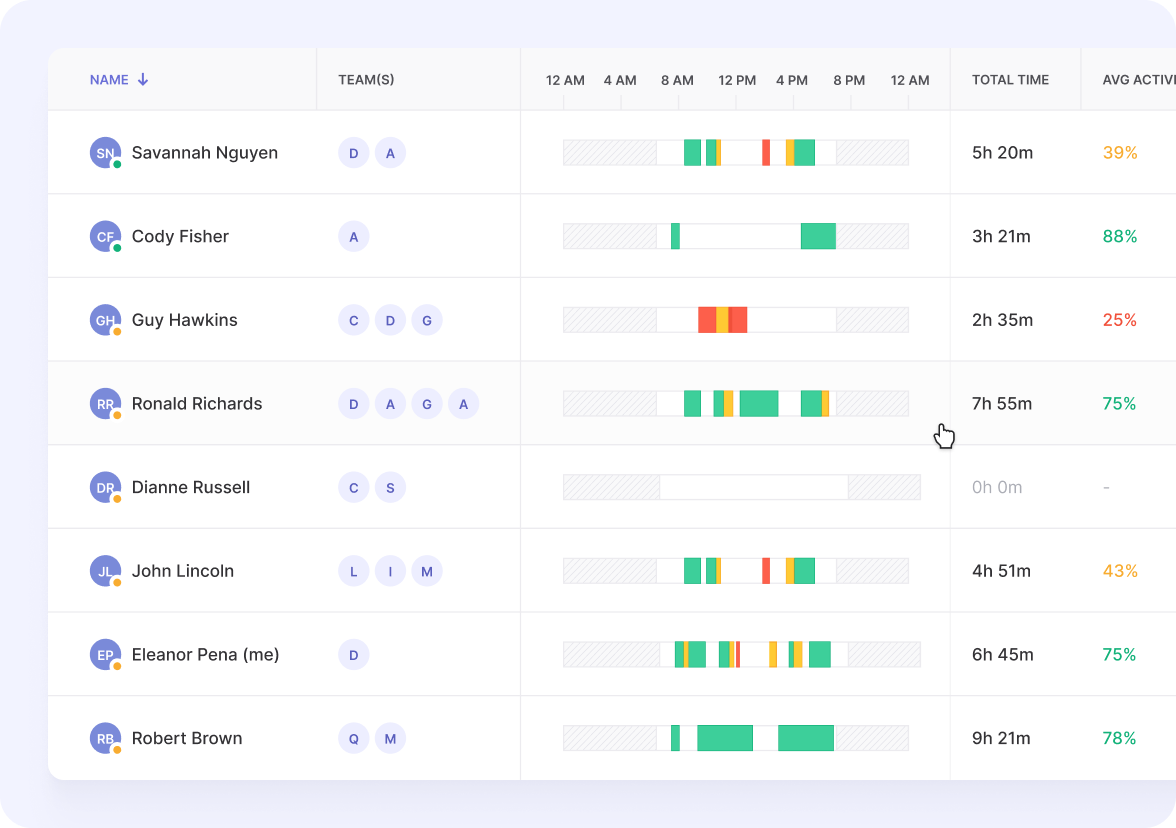
This metric is usually represented through a percentage or a rating system that indicates how actively an employee is using their computer or workstation.
For instance, high keyboard and mouse activity might correspond to higher activity levels.
The software might track the time spent on specific tasks or projects, offering a granular view of an employee’s day. This data helps managers understand which tasks or projects are consuming the most time and whether employees are allocating their efforts effectively.
Idle time
Idle time tracking is another crucial aspect of these reports. This feature monitors periods of inactivity or low activity on an employee’s workstation.
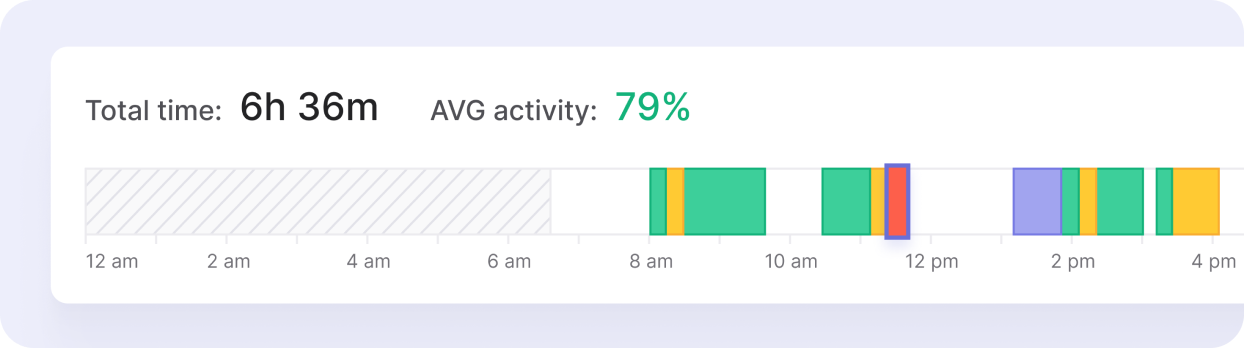
Traqq highlights periods of inactivity in red.
Idle times could indicate when an employee is taking a break, is in a meeting, or is potentially disengaged or distracted.
By analyzing patterns in idle times, managers can identify possible issues with workload, employee engagement, or time management. It also helps in ensuring that work hours are utilized efficiently and can be a prompt for checking in on employee well-being or workflow bottlenecks.
Web and app usage reports
Web and app usage reports provide insights into the digital tools and platforms employees use during work hours. These reports detail which applications and websites are accessed most frequently and the duration of their usage.
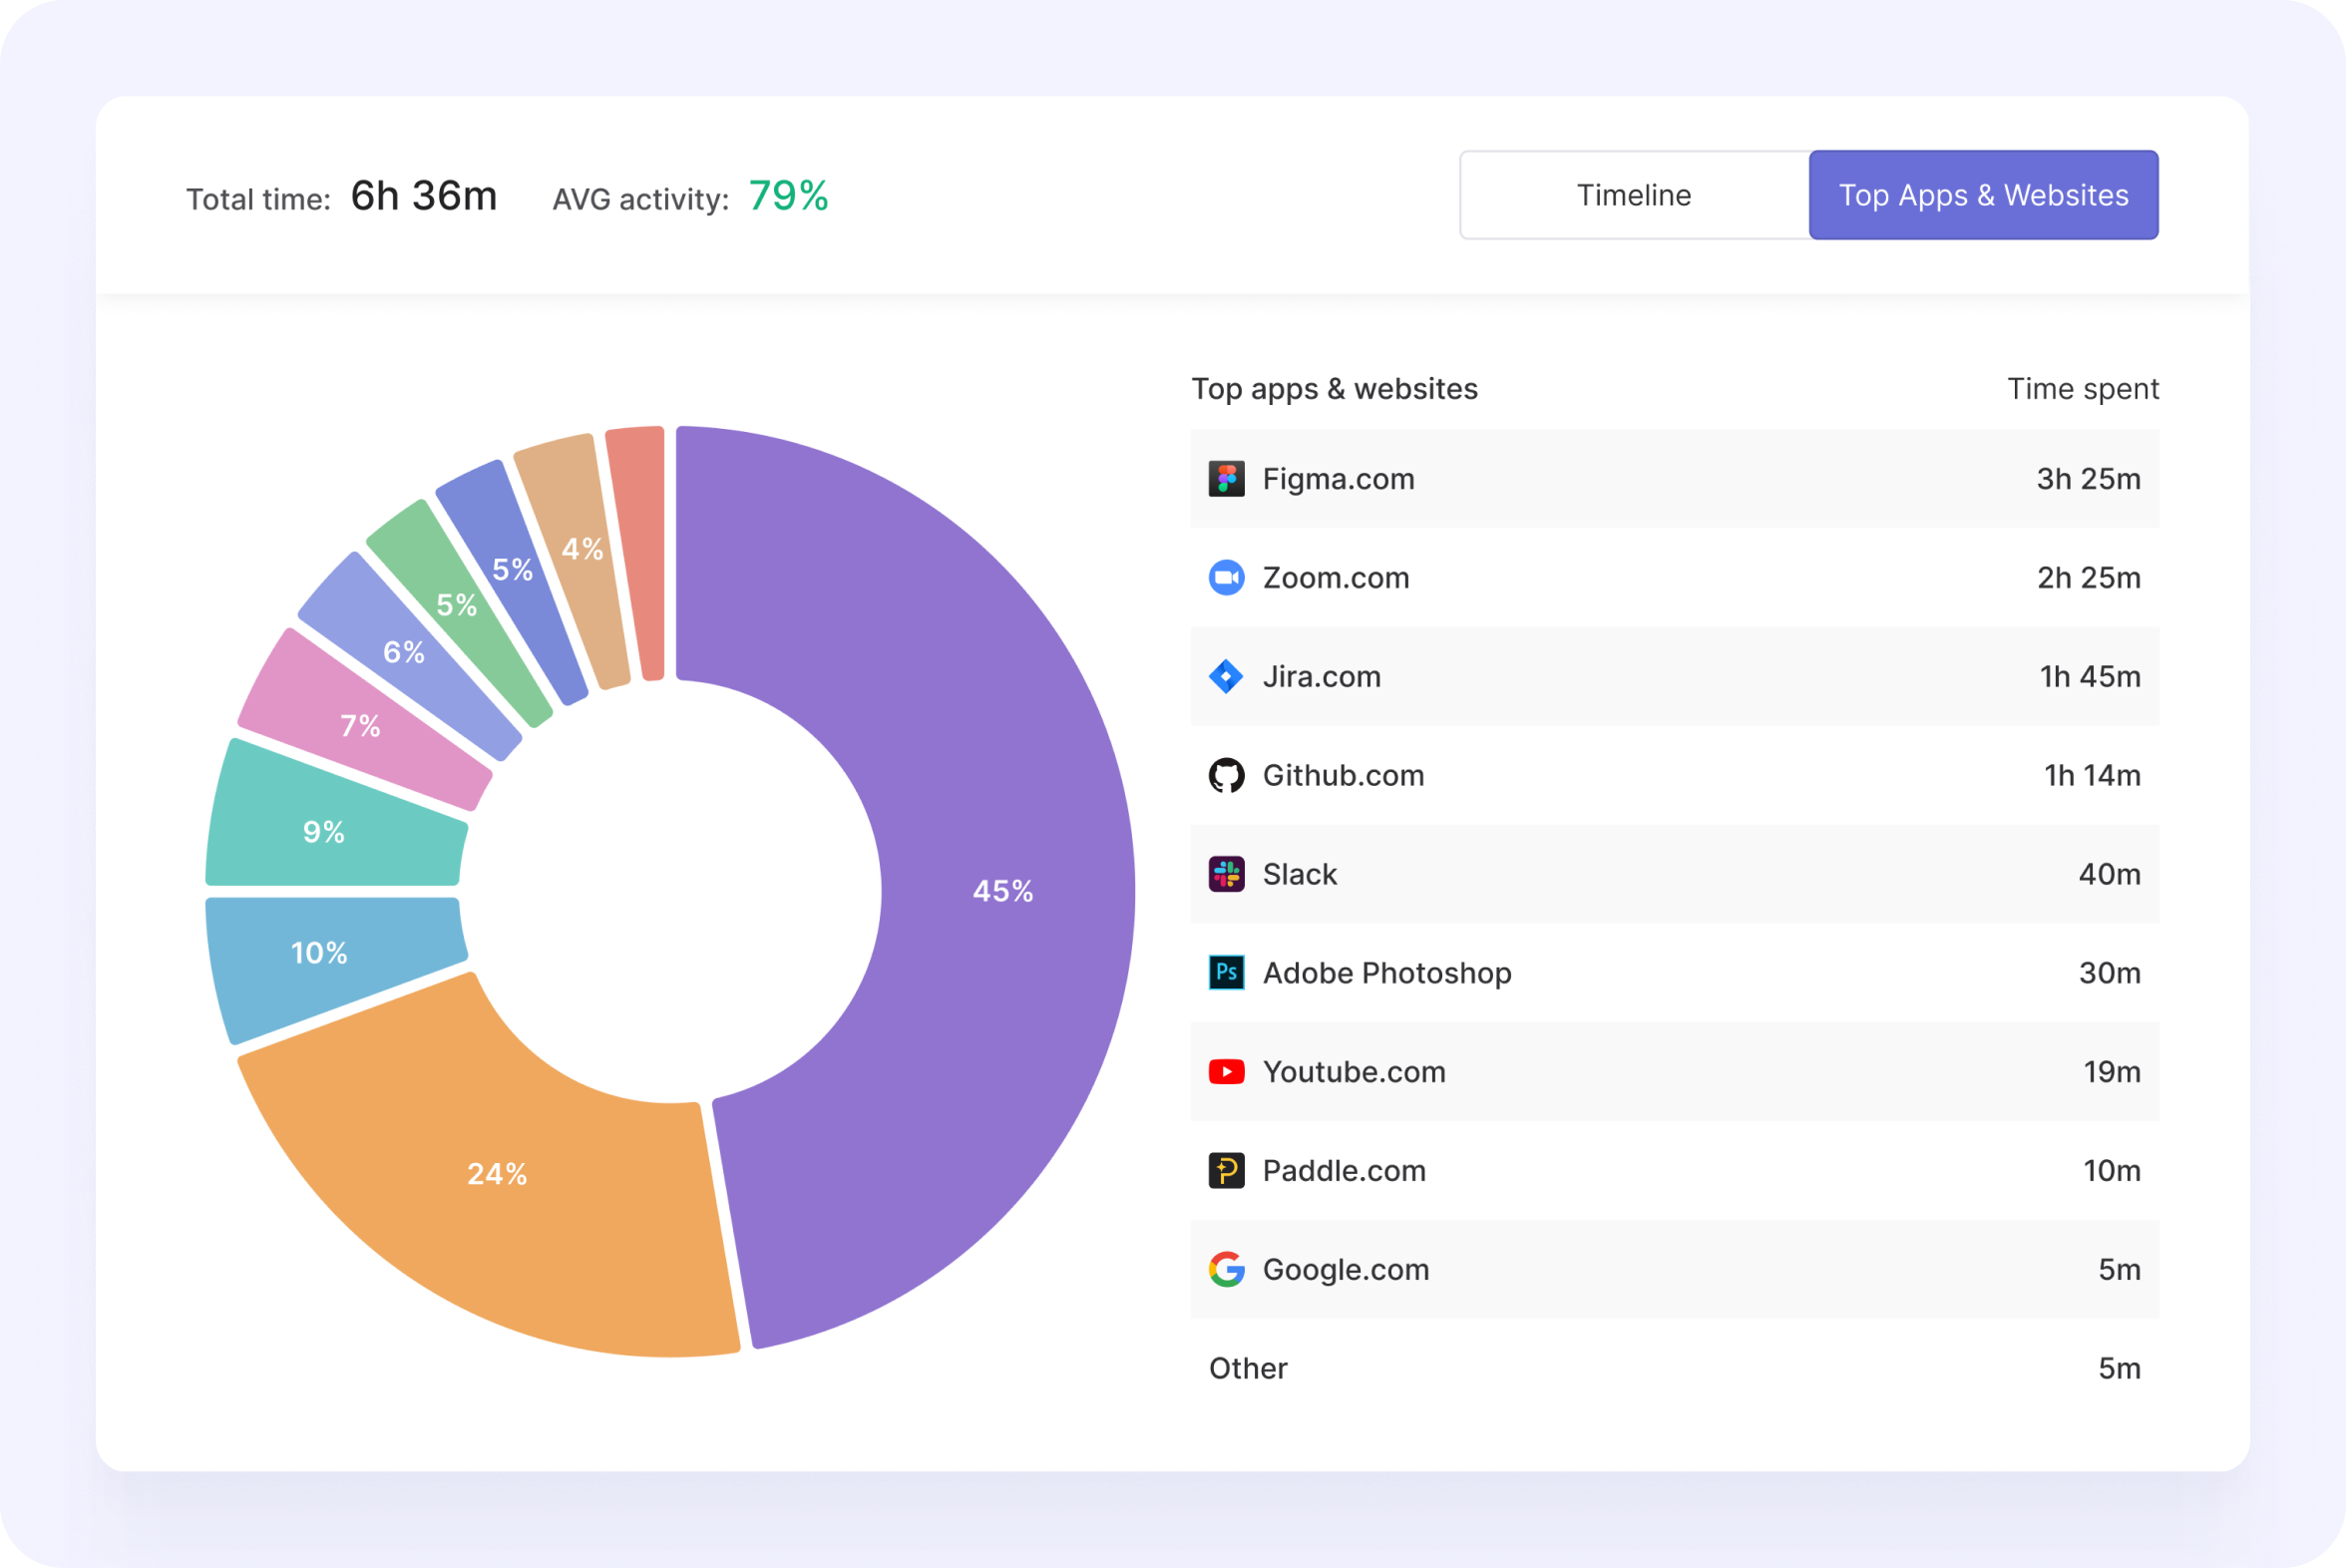
This information is crucial for several reasons: it identifies the software tools that are essential for productivity, flags potential misuse of company resources (like excessive use of social media or non-work-related sites), and helps in assessing whether employees have the right tools to perform their tasks efficiently.
Additionally, these reports can be instrumental in detecting potential security risks, like the use of unauthorized applications that may compromise company data.
What to Look For in Productivity Report Software?
When looking for report software, it’s essential to find a tool that not only captures detailed data but also offers flexibility and convenience in managing and sharing this information. Here are key features to consider:
Detailed team analysis & reports
- Look for software that provides comprehensive reports on team performance. This should include analyses of weekly summaries, time and activity tracking, app and URL usage, and idle time reports.
- The ability to customize reports by filtering data by groups, individuals, and time periods is crucial. This feature helps in gaining insights into employee working hours and understanding factors affecting individual and team performance, ultimately optimizing company performance and profitability.
Exporting reports in multiple formats
- The flexibility to download or export reports in various file formats, such as CSV and PDF, is important.
- Features like having reports sent directly to your email address enhance convenience and ensure you have a permanent record that can be used for performance reviews and tracking progress over time.
Sharing reports with team members
- Software that allows you to share reports with multiple accounts directly from the web app is beneficial. This ensures that selected admins or managers can access the same data for a unified view of team performance.
Scheduling and automatic report generation
- A tool like Traqq offers the ability to set automatic generation and sending of reports to specific emails at chosen times and frequencies.
- This automated process saves time and ensures that you regularly receive updated data without having to manually trigger report generation.
By ensuring these features are present in report software, you can effectively track, analyze, and share key metrics, aiding in informed decision-making and strategic planning for enhancing team performance and efficiency.
Benefits of Productivity Reports and Monitoring Tools
The implementation of productivity reports and monitoring tools in the workplace brings a multitude of benefits, significantly impacting overall organizational performance. These tools provide insights that can lead to improved operations, enhanced employee engagement, and a deeper understanding of productivity performance.
Improved performance
One of the most significant benefits of using productivity reports and monitoring tools is the substantial improvement in performance they can foster. By accurately tracking metrics like task completion times, resource utilization, and output quality, these tools enable managers to identify inefficiencies and areas where processes can be optimized.
For example, if a report shows that certain tasks are taking longer than expected, it can prompt a review of the workflow or training methods. This data-driven approach ensures that performance improvements are not based on guesswork but on real, actionable insights.
Employee engagement and satisfaction
Contrary to the misconception that monitoring may negatively impact morale, when implemented thoughtfully, these tools can actually enhance employee engagement and satisfaction.
By providing clear metrics and goals, employees gain a better understanding of their contributions and expectations.
This clarity can lead to a more engaged workforce, as employees feel more connected to their work and understand how their efforts fit into the bigger picture.
Additionally, productivity tools can highlight achievements and progress, offering opportunities for recognition and rewards, further boosting morale and job satisfaction.
Better insight into employee productivity performance
Monitoring tools and performance reports offer unparalleled insights into individual and team productivity performance. They allow managers to track progress against goals and benchmarks, identify high performers, and provide support where needed.
For instance, an employee consistently exceeding their targets can be recognized and perhaps considered for further development opportunities. Conversely, if an employee is struggling, the data can lead to a constructive conversation about challenges and support.
This level of insight is invaluable for tailoring management strategies, developing training programs, and even for strategic decision-making regarding team composition and leadership.
Employee Productivity Report Templates
If you are not yet ready to commit to an automated reporting solution, these templates are designed to streamline the process of tracking and analyzing employee performance, saving you time and effort in data management.
Whether you’re overseeing a small team or a large department, these customizable templates cater to a range of needs and are easy to adapt to your specific requirements.
Employee workload template
Task completed productivity template
Sales productivity report template
What Is Employee Productivity?
Employee productivity refers to the efficiency and effectiveness with which employees accomplish tasks and goals in the workplace. It’s a measure of the output or results generated by an employee within a given time frame. High employee productivity is often linked to factors like skill level, motivation, work environment, and the use of technology.
For example, in a manufacturing setting, a productive employee might produce more units of a product within an hour compared to the average.
In an office environment, a productive employee might be able to complete their reports more quickly and accurately than others.
Key Productivity Metrics and Formulas
Understanding productivity metrics and formulas is essential for businesses aiming to enhance efficiency and profitability. Here’s a closer look at some of the key metrics:
Labor productivity
Labor productivity measures the output of goods and services per hour worked. It’s calculated as:
Labor Productivity = Total Output / Total Labor Hours
For example, if a factory produces 200 units of a product in 400 labor hours, the labor productivity would be 0.5 units per hour. This metric helps businesses assess how effectively labor is being used to generate output.
Capital productivity
Capital productivity measures the output produced per unit of capital investment, focusing on how effectively a business uses its assets like machinery and equipment.
The formula is:
Capital Productivity = Total Output / Capital Employed
For instance, if a company’s total output value is $1 million with capital employed of $500,000, the capital productivity would be 2. This indicates how well the capital is utilized in producing the output.
Material productivity
Material productivity evaluates the efficiency with which raw materials are converted into finished goods. It’s calculated as:
Material Productivity = Total Output / Total Material Used
For example, if a bakery uses 100 kg of flour to bake 200 loaves of bread, its material productivity is 2 loaves per kg of flour. This metric is crucial for industries where material costs are a significant part of total expenses.
Total factor productivity
Total factor productivity (TFP) measures the efficiency and effectiveness of all inputs used in the production process. It’s a more comprehensive metric, calculated as:
TFP = Total Output / (Labor Input + Capital Input + Material Input)
TFP is particularly useful for analyzing the overall efficiency of a business, including the synergistic effects of all resources.
Quality of work
Quality of work isn’t quantifiable in the same straightforward manner as other productivity metrics, but it’s equally important. It can be assessed through customer satisfaction surveys, product defect rates, or service delivery times.
For example, a decrease in the number of defective products or an increase in customer satisfaction scores can indicate an improvement in the quality of work.
Each of these metrics offers valuable insights into different aspects of a business’s operations.
Wrapping Up
As we sum up all of the above, it becomes clear that a strategic approach to measuring and understanding team productivity is crucial. The templates and software solutions presented in this article offer a direct and efficient way to analyze workforce performance, helping you make informed decisions to enhance team efficiency. By adopting these tools and insights, you’ll be well-equipped to drive productivity and foster a dynamic, high-performing team.
FAQ
What is a good employee productivity rate?
A good employee productivity rate often depends on the industry, the nature of the job, and the specific company standards. Generally, a productivity rate that meets or exceeds the set targets or benchmarks within an organization is considered good.
For instance, in a manufacturing setting, this could be the number of units produced per hour, while in a service industry, it might be the number of clients served or tasks completed. It’s important to consider both the quantity and quality of work when evaluating productivity.
How often should productivity reports be generated and reviewed?
The frequency of generating and reviewing productivity reports can vary based on the needs of the organization and the nature of the work. Many companies find a monthly review cycle to be effective, as it provides a sufficient amount of data to identify trends and make informed decisions.
However, for fast-paced environments or critical projects, a weekly review might be more appropriate. The key is to ensure that the frequency supports timely interventions and decision-making without causing unnecessary administrative burden.
What should be included in a productivity report?
A productivity report should include key metrics that reflect the performance and efficiency of employees. Common elements include:
- Number of tasks or projects completed.
- Quality measures, such as error rates or client satisfaction scores.
- Time spent on different tasks or projects.
- Progress towards specific goals or benchmarks.
- Attendance and punctuality records.
Including both quantitative and qualitative data can provide a more comprehensive view of employee productivity.
What is the 3 by 3 rule for productivity?
The 3 by 3 rule for productivity is a time management technique where you prioritize three main tasks to complete each day, each week, and each month. This rule encourages focusing on the most important tasks that will have the greatest impact, rather than trying to accomplish an overwhelming number of tasks. By limiting the focus to three key tasks in each time frame, the 3 by 3 rule aims to enhance productivity and efficiency while reducing stress and burnout.